Generic selectors
Exact matches only
Search in title
Search in content
Post Type Selectors

Popular stocks

Crypto

CFD

Currencies

Support

Gold

NSDQ – Technical Analysis – 4h

February 9, 2026 08:01

Quick Summary

The NASDAQ 100 Index has shown signs of potential recovery following a recent downturn. Key technical indicators suggest a cautious watch for breakouts at critical levels.

There is a possible bullish reversal after a downward trend, supported by patterns and volume analysis.

Candlestick Analysis

The chart demonstrates a recent downward trend, succeeded by indications of a potential reversal.

A hammer pattern is observed near the trough of the recent decline, suggesting a possible bullish reversal.

The price is testing a short-term breakout zone around 25,000, which was previously a resistance level.

MACD Analysis

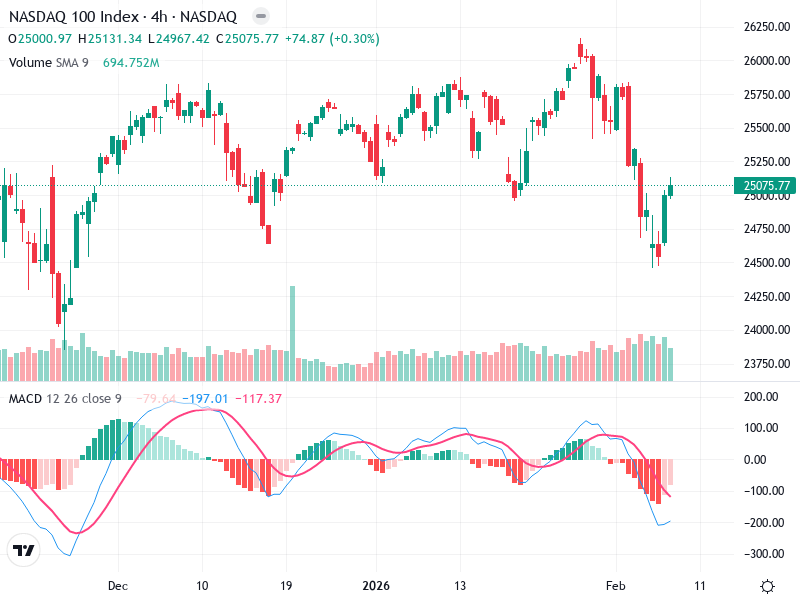
The MACD line is currently below the Signal line, indicating bearish momentum; however, the gap is decreasing, signaling a potential bullish crossover.

The histogram bars are negative yet diminishing, implying a weakening bearish momentum and a possible upcoming shift.

A slight bullish divergence is apparent, as MACD momentum loss occurs while the price shows signs of stabilization.

Volume Analysis

A noticeable spike in volume accompanies the recent price increase, indicating strong buying interest.

The increased volume supports the recent price rise, suggesting the move might be sustainable.

The volume spike during the reversal hints at potential institutional activity.

Support & Resistance

A key support area exists around 24,750, where the price has rebounded.

Immediate resistance is found around 25,250. A breakout above this level could catalyze further bullish momentum.

These levels are crucial for traders to monitor, as breaking above resistance with volume could signal a stronger upward move.

Actionable Insights

Consider a buying strategy if the price breaks above 25,250 with robust volume and a confirmed MACD bullish crossover.

A selling strategy should be considered if there is a rejection at resistance or a bearish MACD crossover appears.

Holding the current position is advisable if patterns persist without clear breakouts or further signals.

The AI Technical Analysis Center is an informational tool only and does not constitute investment or trading advice.
This site is registered on wpml.org as a development site. Switch to a production site key to remove this banner.