Generic selectors
Exact matches only
Search in title
Search in content
Post Type Selectors

Popular stocks

Crypto

CFD

Currencies

Support

Gold

NSDQ – Technical Analysis – 4h

February 10, 2026 08:01

Quick Summary

The chart for this asset reflects recent market dynamics with notable patterns and volume changes.

Recent price actions suggest potential for continued movement in a specific direction.

Focus remains on key levels and indicators for a comprehensive analysis.

Candlestick Analysis

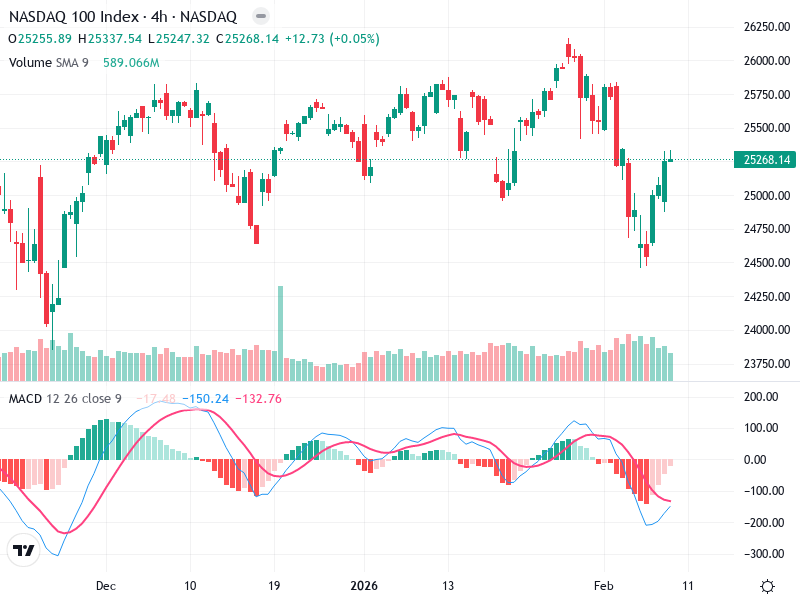
Recently, a pattern resembling a bullish engulfing has appeared, indicating potential bullish reversal. This pattern is significant following the prior strong bearish candles at the support level.

The recent move suggests a recovery from a downtrend, with the current sentiment shifting towards bullish, considering the recent higher low.

There is a noticeable breakout from the recent bottom around 24,800, suggesting a potential shift in momentum.

MACD Analysis

A bullish crossover appears to be forming, which indicates a potential change in momentum to the upside.

The histogram is moving towards the zero line from below, suggesting diminishing bearish momentum and potential bullish divergence.

No clear divergence observed, but the alignment of MACD indicators supports a bullish sentiment.

Volume Analysis

There was an uptick in volume during the recent price increase, supporting the bullish sentiment.

The volume supports the upward price movement, suggesting strong buying activity.

Notable increased volume coincided with recent price bottoming, indicating possible institutional interest.

Support & Resistance

Strong support around the 24,800 level, where the recent reversal initiated.

Immediate resistance is identified near 25,600, and a breakout above this could further confirm the upward move.

The consolidation and subsequent breakout suggest a period of accumulation before the recent move, reinforcing a possible shift to bullish momentum.

Actionable Insights

Consider a cautious buy strategy, watching for confirmation of the bullish trend continuation. A break above 25,600 with strong volume could be a more aggressive entry point.

Observe the resistance level at 25,600 for a breakout or failure that could signal trend continuation or potential pullback.

Failure to maintain above 25,000 might suggest renewed bearish pressure.

The AI Technical Analysis Center is an informational tool only and does not constitute investment or trading advice.
This site is registered on wpml.org as a development site. Switch to a production site key to remove this banner.