Generic selectors
Exact matches only
Search in title
Search in content
Post Type Selectors

Popular stocks

Crypto

CFD

Currencies

Support

Gold

NSDQ – Technical Analysis – 4h

February 12, 2026 08:01

Quick Summary

The NASDAQ 100 Index chart reveals a period of potential consolidation after a recent decline. Analysis shows signs suggesting a short-term bullish reversal may occur if certain conditions are met. The upcoming sessions are critical to confirm the direction.

Candlestick Analysis

Recently, there's a visible bullish engulfing pattern followed by a few green candles, suggesting a potential short-term bullish reversal from the recent downtrend.

A few doji candles are present, indicating indecision in the market.

The chart depicts a sideways trend after a recent sharp decline, signaling potential consolidation.

MACD Analysis

The MACD line is approaching the Signal line from below, which could indicate a potential bullish crossover if the trend continues.

The histogram bars are getting shorter, moving towards the baseline. This suggests that the downwards momentum is slowing.

No significant divergence between MACD and price action at this point.

Volume Analysis

There was a considerable volume spike accompanying the recent downfall, indicating strong selling pressure.

Recent price consolidation is occurring on lower volume, often a sign of a potential reversal or significant move when volume increases.

The large volume spike during the sharp decline could suggest institutional selling.

Support & Resistance

Strong support around 25,000, evidenced by recent bounce.

Resistance is likely around 25,750, where price previously faced rejection.

Monitoring these levels is crucial for future movements.

Actionable Insights

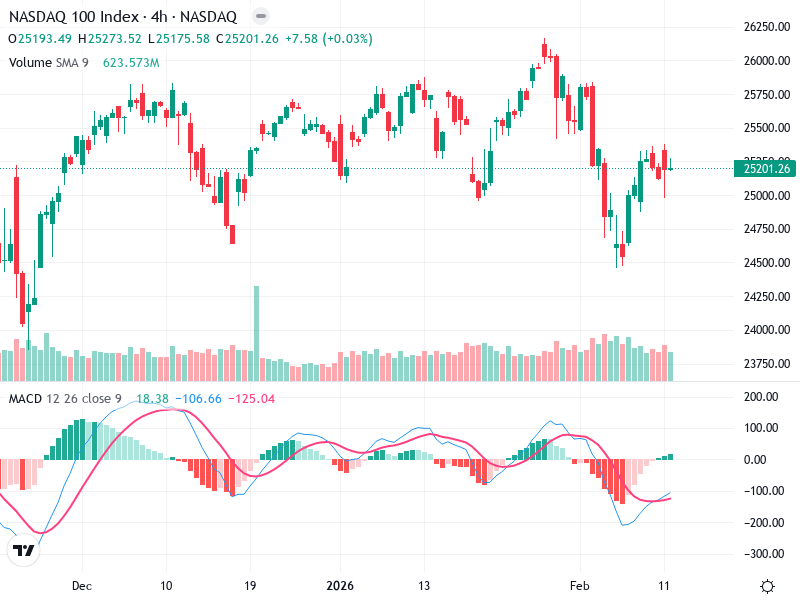
Consider buying if the price sustains above 25,500 and MACD confirms a bullish crossover, targeting 25,750.

Look for bearish confirmations, such as a failed attempt to break 25,750 or bearish patterns near resistance.

Holding is recommended if price remains sideways without significant volume changes.

The AI Technical Analysis Center is an informational tool only and does not constitute investment or trading advice.
This site is registered on wpml.org as a development site. Switch to a production site key to remove this banner.