Generic selectors
Exact matches only
Search in title
Search in content
Post Type Selectors

Popular stocks

Crypto

CFD

Currencies

Support

Gold

NSDQ – Technical Analysis – 4h

February 23, 2026 08:00

Quick Summary

The chart for this asset indicates a primarily sideways trend with both upward and downward price movements.

Recent green candlesticks suggest a potential short-term bullish trend.

Key levels of support and resistance are identified, critical for future price actions.

Candlestick Analysis

The chart reveals a primarily sideways trend with both upward and downward price movements.

Observing a few candlestick patterns like doji and hammer at potential reversal points.

Recently, there are green candlesticks indicating a short-term bullish movement.

MACD Analysis

The MACD line has crossed above the Signal line, suggesting a bullish momentum.

The histogram shows increasing green bars, indicating growing bullish momentum.

No significant divergences detected between MACD and price action at the moment.

Volume Analysis

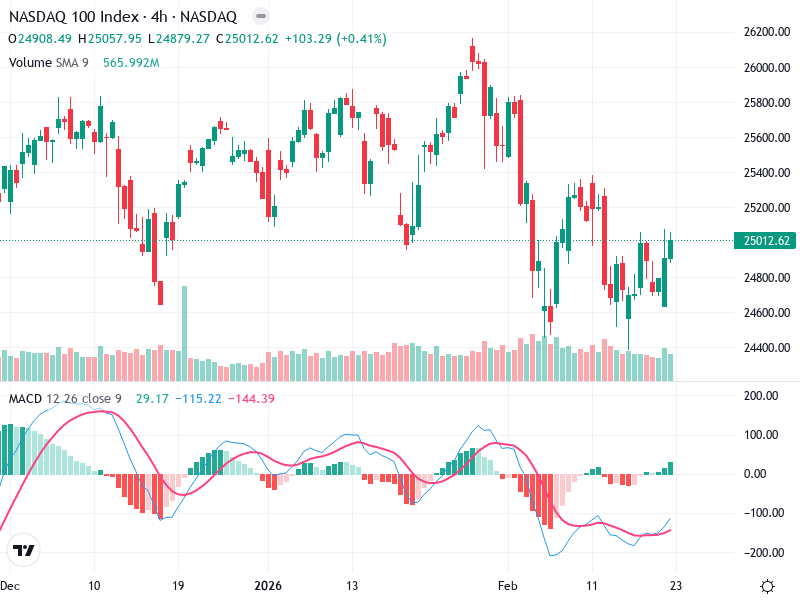
Volume appears to spike slightly during recent upward movements, supporting the current bullish sentiment.

Earlier in the chart, there are significant volume spikes, possibly indicating institutional participation.

Volume plays a crucial role in confirming the ongoing trend.

Support & Resistance

Strong support around the 24600 level.

Immediate resistance present near the 25500 level.

These levels are critical as potential zones for reversals or confirmed breakouts.

Actionable Insights

Consider buying if the price breaks and sustains above 25500 with strong volume.

Watch out for selling signals if the price drops below 24600.

If within the range of 24600-25500, consider holding as the market is consolidating.

The AI Technical Analysis Center is an informational tool only and does not constitute investment or trading advice.
This site is registered on wpml.org as a development site. Switch to a production site key to remove this banner.