Generic selectors
Exact matches only
Search in title
Search in content
Post Type Selectors

Popular stocks

Crypto

CFD

Currencies

Support

Gold

NSDQ – Technical Analysis – 4h

February 27, 2026 08:00

Quick Summary

The NASDAQ 100 Index is showing signs of recovery on the 4-hour chart. Recent sessions have demonstrated a bullish bias, attempting to climb out of a previous downtrend. Continued analysis is necessary as the index approaches key resistance levels.

Candlestick Analysis

Recent candles show a strong bullish movement, indicated by large green candlesticks following a period of consolidation.

No clear reversal patterns like hammers or dojis are present at this moment.

There appears to be a recovery attempt in place after a bearish downtrend. The last few sessions have shown a bullish bias.

MACD Analysis

There is a recent bullish crossover where the MACD line crosses above the Signal line, indicative of a potential bullish reversal.

The histogram is positive and expanding, highlighting increasing bullish momentum.

No significant divergence is currently observed between MACD and price action.

Volume Analysis

The trading volume has been higher than the volume moving average during the recent rise, supporting the price increase.

The increase in volume with increasing price suggests validation of the upward move. This may indicate some level of institutional buying.

A notable volume spike matches the recent upward price movement, which could signal strong buying interest.

Support & Resistance

Key support is around the 24,800 level, which has been tested and held recently.

Immediate resistance is around the 25,250 level. Sustained movement above it could target the next resistance near 25,600.

Continuous monitoring is advised as the price approaches key resistance levels for any signs of reversal or consolidation.

Actionable Insights

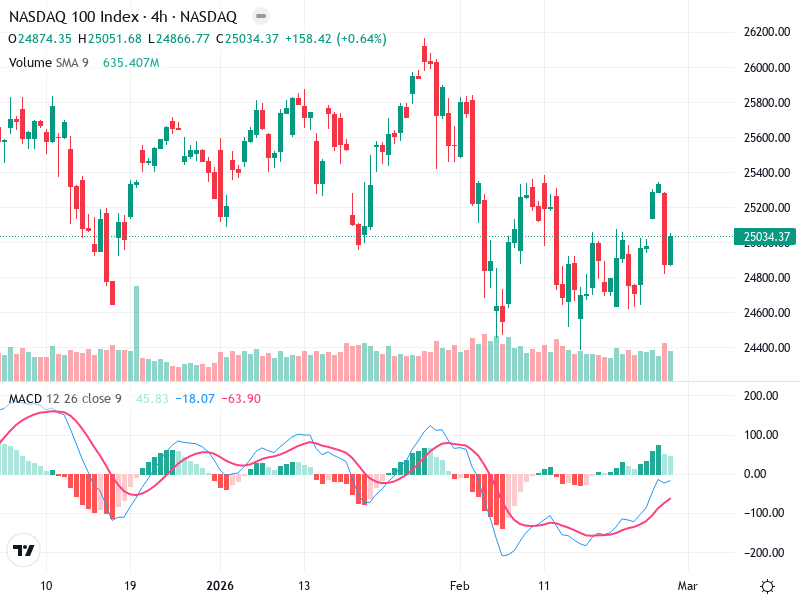
If the price holds above 25,250 with continued volume support, consider buying opportunities for further upside potential towards 25,600.

Failure to maintain above 25,250 might signal a pullback opportunity, especially if volume decreases.

Confirmation of price maintaining above current resistance levels and watch the MACD for any signs of weakening momentum.

The AI Technical Analysis Center is an informational tool only and does not constitute investment or trading advice.
This site is registered on wpml.org as a development site. Switch to a production site key to remove this banner.