Generic selectors
Exact matches only
Search in title
Search in content
Post Type Selectors

Popular stocks

Crypto

CFD

Currencies

Support

Gold

NSDQ – Technical Analysis – 4h

March 2, 2026 08:00

Quick Summary

The NASDAQ 100 Index is currently exhibiting a sideways trading pattern, fluctuating between key support and resistance levels.

The index’s movement is characterized by a lack of strong convictions in either direction, as seen in recent candlestick formations and volume analysis.

Candlestick Analysis

Recently, there are some small-bodied candles, indicating indecision in the market.

Previously, red and green candlesticks are observed with alternating lengths, suggesting mixed market sentiment.

There are no distinct bullish engulfing, doji, or hammer patterns in recent sessions.

MACD Analysis

The MACD line is slightly below the Signal line, indicating a weak bearish momentum.

The MACD histogram shows slightly increasing positive bars, suggesting a mild bullish momentum might be developing.

There isn't an apparent divergence between the MACD and the price action, indicating that the MACD is reflective of the current price movements.

Volume Analysis

Recently, there is no significant spike in volume, implying limited institutional activity or strong conviction moves.

The volume is relatively average, not supporting significant bullish or bearish moves.

This lack of volume support aligns with the overall sideways trend of the price action.

Support & Resistance

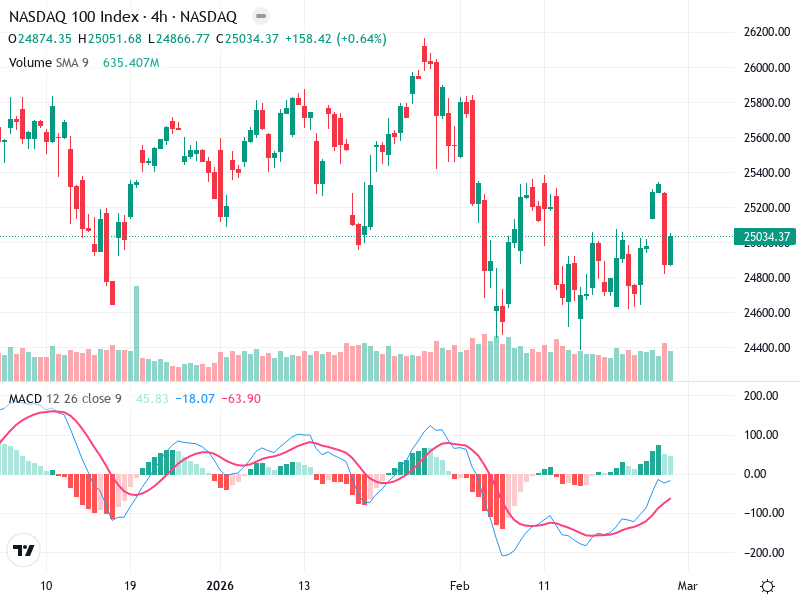
Resistance: Around 25,800—this level has previously capped advances and could be crucial for a bullish breakout.

Support: Approximately at 24,400—this level has been tested multiple times and held, thus serving as an important support zone.

Breaking above 25,800 with volume confirmation could signal a bullish trend reversal, whereas breaching 24,400 might indicate a further bearish move.

Actionable Insights

Potential buying opportunity if the index breaks above 25,800 with strong volume.

Consider selling or shorting if the index falls below 24,400 with high volume.

Current sideways trend suggests a hold strategy unless significant breakout or breakdown is confirmed.

The AI Technical Analysis Center is an informational tool only and does not constitute investment or trading advice.
This site is registered on wpml.org as a development site. Switch to a production site key to remove this banner.