Generic selectors
Exact matches only
Search in title
Search in content
Post Type Selectors

Popular stocks

Crypto

CFD

Currencies

Support

Gold

NSDQ – Technical Analysis – 4h

March 5, 2026 08:00

Quick Summary

The asset is showing signs of consolidation, with the potential for a breakthrough above key resistance levels. Monitoring the volume and MACD signals could provide early indications of a directional move.

Further price movement will depend heavily on breaking the established support and resistance levels. Stay tuned for updates on market conditions that might impact the asset’s trajectory.

Candlestick Analysis

Recent bullish candles indicate a potential upward movement, though no strong patterns like bullish engulfing or hammer are visible.

The trend appears to be sideways with short-term bullish attempts; no strong directional movement is firmly established.

The price is approaching a minor resistance around 25,200. A breakout above this level might suggest further upside.

MACD Analysis

The MACD line is above the Signal line, indicating a recent bullish crossover.

The histogram is in positive territory, suggesting upward momentum is building, but it's not significant yet.

No clear divergence is apparent between MACD and price, aligning with a sideways pattern.

Volume Analysis

Volume has been relatively consistent, with a slight increase during recent green candles, supporting the upward price attempt.

The volume supports the small price upticks but lacks conviction needed for larger movements.

No noticeable spikes, indicating a lack of strong institutional activity.

Support & Resistance

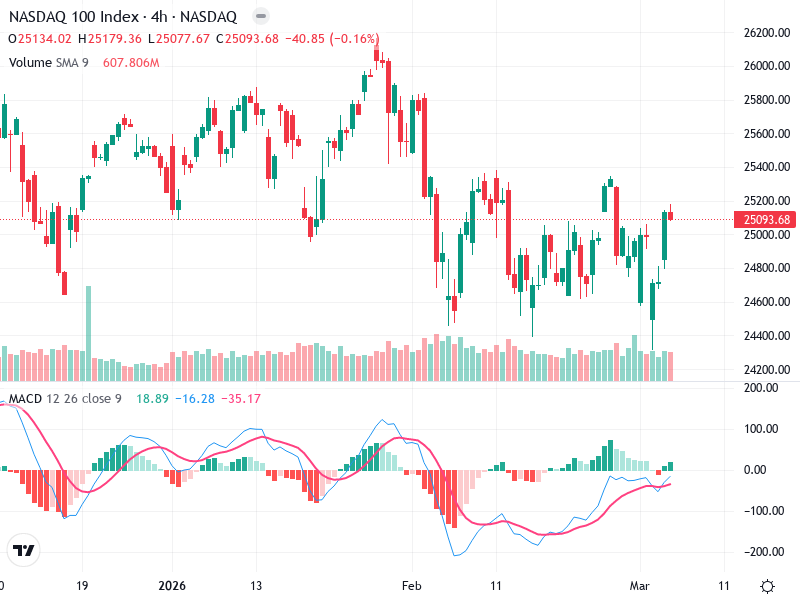
Around 24,600, the area has been tested multiple times, providing a floor for now.

Around 25,200, the price has trouble breaking past this level, making it a crucial resistance zone.

No significant new support or resistance levels identified outside these key areas.

Actionable Insights

Consider entering if price breaks and closes above 25,200 with significant volume.

Maintain current positions if volume remains steady and price holds above 24,600.

Caution if price declines back towards or below 24,600.

The AI Technical Analysis Center is an informational tool only and does not constitute investment or trading advice.
This site is registered on wpml.org as a development site. Switch to a production site key to remove this banner.