Generic selectors
Exact matches only
Search in title
Search in content
Post Type Selectors

Popular stocks

Crypto

CFD

Currencies

Support

Gold

NSDQ – Technical Analysis – 4h

September 8, 2025 07:00

Quick Summary

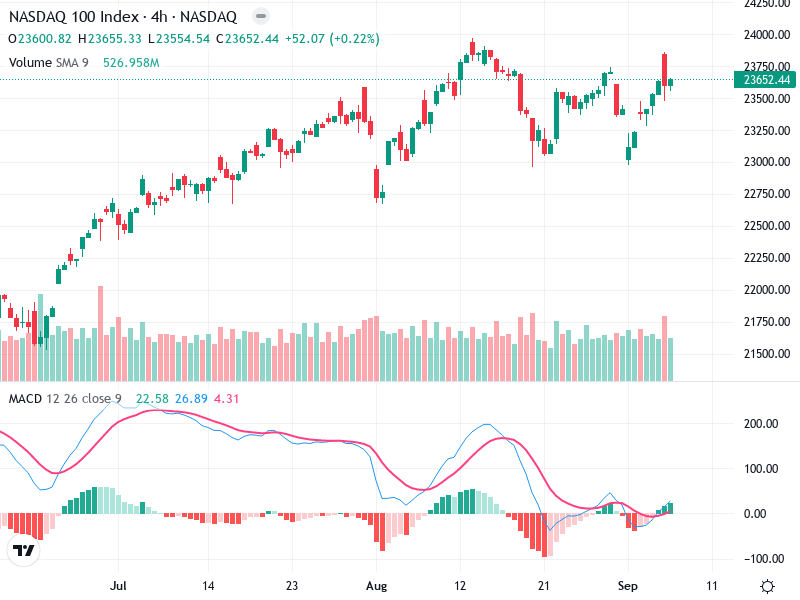
This technical analysis delves into the recent trends observed in the NASDAQ 100 Index, focusing on candlestick formations, MACD indicators, and volume data. Notably, the chart highlights potential zones of support and resistance, which could influence future price movements.

The analysis offers insights into actionable strategies, providing guidance for both bullish and bearish scenarios. Overall, the index reflects a cautiously bullish sentiment supported by key technical indicators.

Candlestick Analysis

Recently, there's a bullish candlestick indicating potential upward momentum.

Earlier, the presence of a bullish engulfing pattern around the start of August suggests a trend reversal to the upside.

The trend appears generally bullish, with higher highs and higher lows since mid-July.

MACD Analysis

There is a recent bullish crossover of the MACD line above the Signal line, indicating potential upward momentum.

The histogram shows increasing positive bars, suggesting strengthening bullish momentum.

Currently, there are no clear divergences; the MACD is moving in line with price action.

Volume Analysis

An increase in volume during the recent upward price movement supports the bullish trend.

There was a notable spike in volume during the breakout above 23,600, indicating possible institutional buying.

The consistency of volume above the moving average during upward moves confirms the strength of the trend.

Support & Resistance

Around 23,600, a previous resistance level now acts as support.

The next resistance is near 23,750, where earlier peaks occurred.

Maintaining levels above 23,600 could signal further bullish continuation, while failure to hold could lead to a pullback.

Actionable Insights

Consider buying on pullbacks to the 23,600 level if volume remains strong, looking for a target towards the 23,750 resistance.

Watch for bearish patterns or a bearish MACD crossover for potential shorting opportunities.

Long positions should be maintained as long as the price remains above the support level and the MACD supports bullish sentiment.

The AI Technical Analysis Center is an informational tool only and does not constitute investment or trading advice.
This site is registered on wpml.org as a development site. Switch to a production site key to remove this banner.