Generic selectors
Exact matches only
Search in title
Search in content
Post Type Selectors

Popular stocks

Crypto

CFD

Currencies

Support

Gold

NSDQ – Technical Analysis – 4h

March 9, 2026 08:00

Quick Summary

The NASDAQ 100 Index 4-hour chart reveals mixed candlestick patterns with no clear bullish or bearish dominance. Recent sessions show a slight bearish trend with the index unable to sustain higher highs.

The MACD and volume analyses suggest a neutral-to-bearish outlook, with key support and resistance levels identified between 24,600 and 25,800.

Candlestick Analysis

The candlestick layout shows mixed patterns, lacking definitive bullish or bearish formations. Recent candles are characterized by small bodies indicating market indecision.

The overall trend suggests a lateral to slightly bearish movement as the asset struggles with achieving higher highs and preference for lower lows.

Breakout zones are identified around 25,800, signaling potential bullish sentiment, while 24,600 acts as a pullback zone indicating repeated support.

MACD Analysis

The current MACD configuration shows the MACD line slightly trailing the Signal line, pointing towards a bearish crossover with possible negative momentum.

The histogram is negative and slightly shrinking, indicating diminishing bearish momentum but still prevalent.

No significant divergences observed between the MACD indicator and price action that might suggest a major trend reversal.

Volume Analysis

Recent volumes have remained consistent with the average, without displaying substantial spikes.

The current volume does not strongly corroborate recent price declines, suggesting a lack of conviction in bearish sentiment.

No unusual volume spikes detected, indicating the absence of significant institutional activity.

Support & Resistance

24,600 is identified as a strong support level, recently tested by the market.

24,200 represents a previous session's lower range, acting as an additional support point.

Key resistance is positioned at 25,800, while another level is noted at 25,200, a frequent point of price retreat.

Actionable Insights

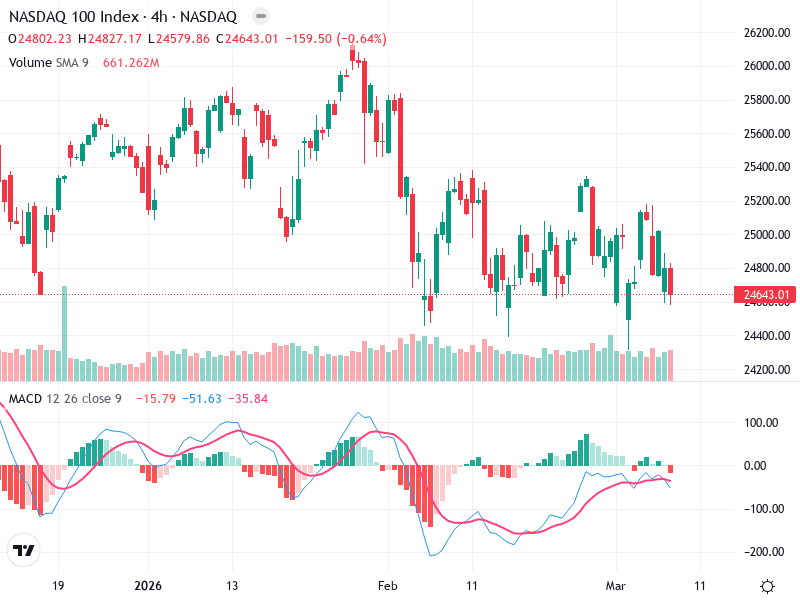
Consider initiating a buy if the price decisively moves and holds above 25,800, confirmed by increased volume.

A sell strategy could be considered if the asset’s price declines below 24,600 with strong bearish volume, suggesting further downside.

Holding is advisable if the price remains between 24,600 and 25,800, in the absence of volume confirmation for any directional move. Monitor for MACD divergences or volume spikes as signals for potential breakouts or breakdowns.

The AI Technical Analysis Center is an informational tool only and does not constitute investment or trading advice.
This site is registered on wpml.org as a development site. Switch to a production site key to remove this banner.