Generic selectors
Exact matches only
Search in title
Search in content
Post Type Selectors

Popular stocks

Crypto

CFD

Currencies

Support

Gold

NSDQ – Technical Analysis – 4h

March 11, 2026 08:01

Quick Summary

The NASDAQ 100 Index is currently exhibiting various technical signals. The 4-hour chart shows a mixture of bullish and bearish patterns, indicating a complex outlook. A significant focus is on potential breakouts and MACD crossovers.

Candlestick Analysis

The recent formation shows a bullish engulfing pattern, suggesting a potential upward movement.

There is a presence of doji candles in the sideways trend, indicating indecision among traders.

The chart has been experiencing a sideways trend with lower highs, indicating potential bearish pressure.

MACD Analysis

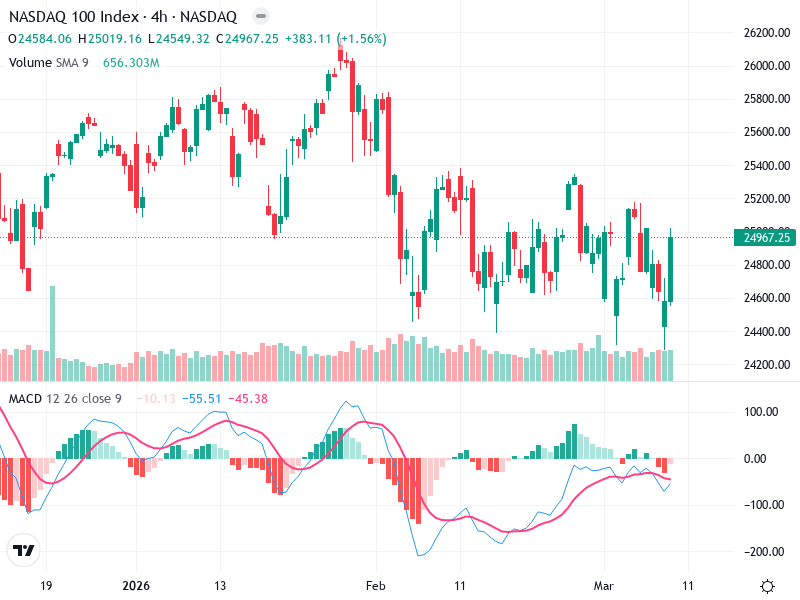
The MACD line is about to cross above the Signal line, suggesting a potential bullish crossover.

Histogram bars are shrinking towards zero, indicating a possible shift in momentum from bearish to bullish.

No clear divergences are observed, but attention should be paid to any forthcoming price action that may deviate from MACD signals.

Volume Analysis

Volume remains relatively stable, but there are noticeable spikes aligning with market rebounds, supporting bullish sentiment during these points.

The downtrend in volume as prices stagnate could indicate weakening selling pressure.

Larger volume spikes during attempted breakouts suggest potential institutional interest.

Support & Resistance

There is strong support at 24500 which has held multiple times.

Key resistance is at 25200, where prices have struggled to break through.

The analysis of these levels is crucial for determining potential future price movements.

Actionable Insights

Consider entering a long position on a confirmed breakout above 25200 with strong volume.

If prices fall below 24500, it might trigger further downside momentum, making it a sell signal.

For current positions, monitor the resistance at 25200 and the MACD crossover for potential bullish continuation.

The AI Technical Analysis Center is an informational tool only and does not constitute investment or trading advice.
This site is registered on wpml.org as a development site. Switch to a production site key to remove this banner.