Generic selectors
Exact matches only
Search in title
Search in content
Post Type Selectors

Popular stocks

Crypto

CFD

Currencies

Support

Gold

NSDQ – Technical Analysis – 4h

March 12, 2026 08:00

Quick Summary

The chart shows a consolidated trend with a slight bearish inclination, reflecting a market lacking clear directional movement. Observations indicate a sideways movement, with price fluctuations confined within a defined range. Notable resistance and support levels are shaping trading strategies, crucial for making informed trading decisions.

Candlestick Analysis

The overall trend appears to be sideways with a slight bearish bias. The price has been oscillating within a range without a clear direction.

No significant bullish patterns like engulfing or hammer are observed. Some candles show indecision (e.g., doji), suggesting uncertainty.

A key pullback zone is around 25,000, while resistance seems to be forming near 25,500.

MACD Analysis

The MACD line is nearing the Signal line from below, suggesting potential bullish momentum if it crosses.

The histogram shows decreasing bearish momentum, hinting at a possible reversal or consolidation.

No clear divergence is visible between the MACD and price action, supporting the current sideways trend.

Volume Analysis

Volume spikes occur with some price movements, indicating interest at those points.

Volume is generally stable, which supports the lack of strong directional movement.

Recent volume spikes coincide with small pullbacks, possibly indicating minor institutional activity.

Support & Resistance

Key support is around the 24,800 mark, where prices have previously rebounded.

Resistance is evident around 25,500, where previous uptrends have halted.

Additional resistance levels appear to be forming, shaping future price actions.

Actionable Insights

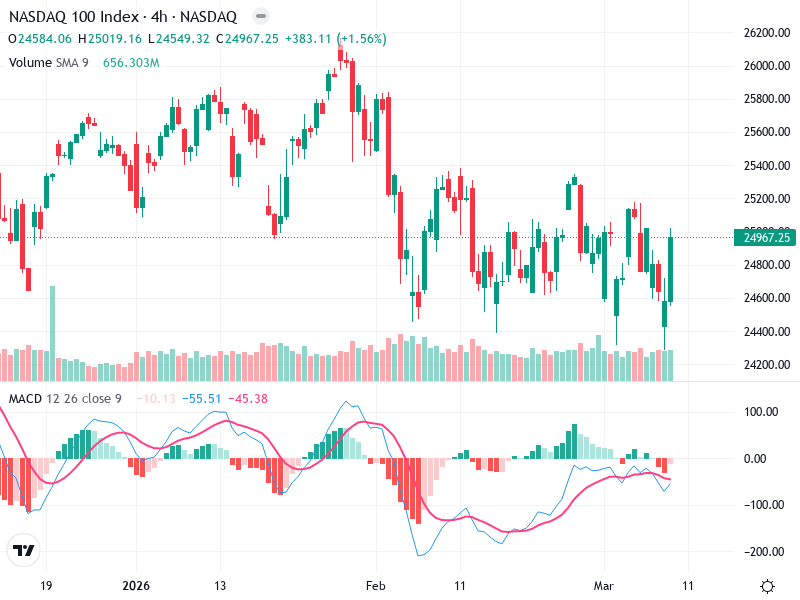
Given the sideways trend with slight bearish potential, consider a range trading strategy. Buy near support (24,800) and sell near resistance (25,500).

Watch for a confirmed MACD bullish crossover, which could signal a long opportunity. Conversely, a break below 24,800 with strong volume may suggest selling pressure.

Stay alert for false breakouts due to the consolidation phase. Monitor for significant volume with price movement for confirmation.

The AI Technical Analysis Center is an informational tool only and does not constitute investment or trading advice.
This site is registered on wpml.org as a development site. Switch to a production site key to remove this banner.