Generic selectors
Exact matches only
Search in title
Search in content
Post Type Selectors

Popular stocks

Crypto

CFD

Currencies

Support

Gold

NSDQ – Technical Analysis – 4h

March 13, 2026 08:00

Quick Summary

The NASDAQ 100 Index shows a cautious market sentiment with a downside risk bias.

Although there are no strong bullish signals, careful monitoring is advised.

Candlestick Analysis

The current trend appears to be sideways with a bearish bias.

The index is making lower highs but the lows are slightly rising, indicating indecision in the market.

There are multiple bearish candlesticks indicating selling pressure, especially near the 25,800 level.

MACD Analysis

There is a bearish crossover where the MACD line is below the Signal line, which is a negative signal for the index.

The MACD histogram shows negative momentum, consistent with the bearish crossover.

No clear divergences between the MACD and price action are noted.

Volume Analysis

There has been relatively stable volume, with no significant volume spikes.

This suggests that moves might lack conviction.

The absence of strong volume on down moves may indicate a consolidation phase.

Support & Resistance

The key support level is around 24,500.

Sustained trading below this level could result in further declines.

Noticeable resistance is around 25,800, where previous rallies have failed.

Actionable Insights

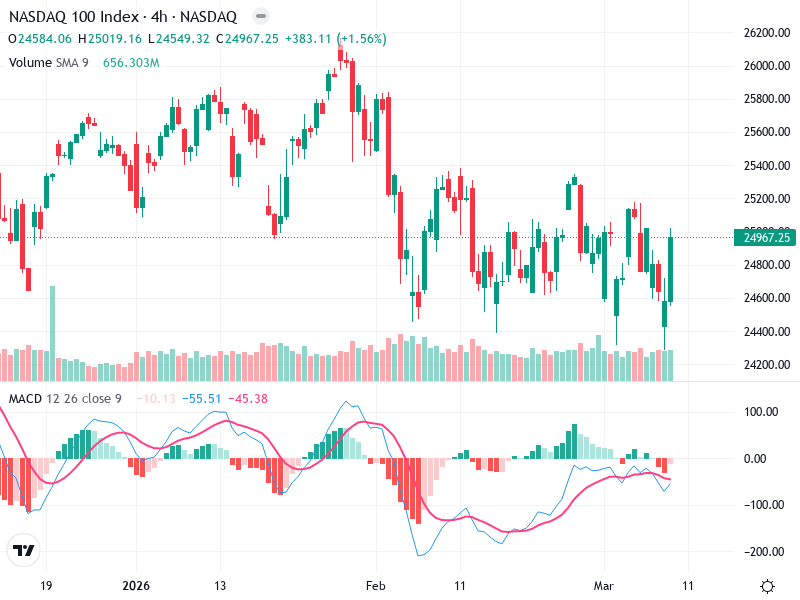
Consider a sell strategy if the price breaks below the 24,500 support with high volume, as it may lead to accelerated downturns.

A buy strategy could be considered on a bounce near 24,500 if accompanied by a bullish reversal pattern and increasing volume.

Watch for confirmation signals that include a strong volume spike on either a breakout or reversal pattern.

The AI Technical Analysis Center is an informational tool only and does not constitute investment or trading advice.
This site is registered on wpml.org as a development site. Switch to a production site key to remove this banner.