Generic selectors
Exact matches only
Search in title
Search in content
Post Type Selectors

Popular stocks

Crypto

CFD

Currencies

Support

Gold

NSDQ – Technical Analysis – 4h

September 10, 2025 07:00

Quick Summary

The chart of shows intriguing dynamics with distinct patterns emerging. The asset displays a consistent trend, suggesting potential opportunities for market participants. Monitoring key levels can provide insights into future price movements.

Candlestick Analysis

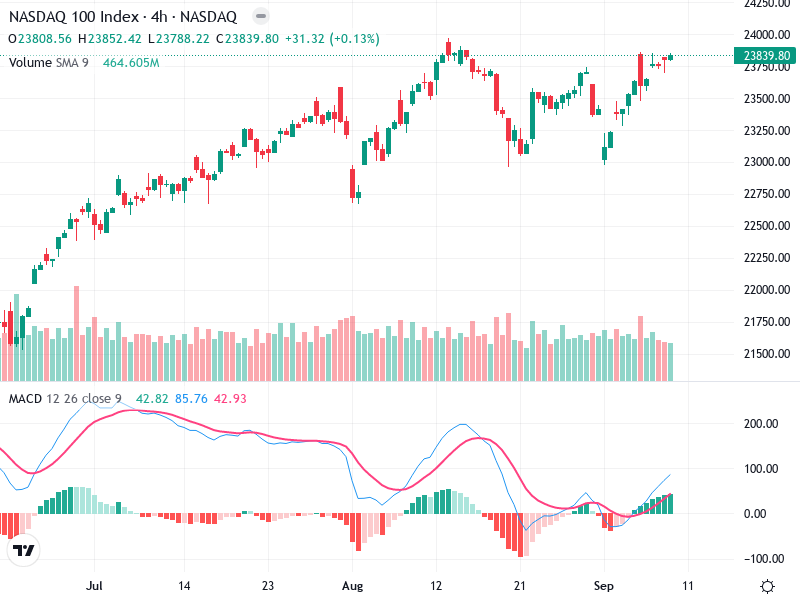
The overall trend is bullish, indicated by the ascending pattern of higher highs and higher lows.

The consistent presence of green candles suggests steady upward momentum, though no strong reversal candlestick patterns like a bullish engulfing or hammer are present.

The price is approaching a key resistance level around the recent highs near 24,000, signaling a potential breakout zone for further upside.

MACD Analysis

The MACD line is slightly above the Signal line, indicating a bullish crossover and upward momentum.

The MACD histogram is gradually increasing, which reflects positive momentum and reinforces potential bullish sentiment.

No significant divergence between MACD and price supports the current trend.

Volume Analysis

Volume appears steady but slightly below average, suggesting moderate participation in recent price movements.

The absence of high volume on recent peaks suggests potential caution, as strong breakouts typically require volume confirmation.

Monitoring volume levels is crucial to validate any upward movements.

Support & Resistance

Around 24,000 is the immediate resistance level, critical for further bullish continuation.

Key support is near 23,000, providing a buffer against potential pullbacks.

These levels will be instrumental in determining the next directional move.

Actionable Insights

Consider buying on a confirmed breakout above 24,000 with increased volume to validate upward movement.

Watch for price rejection at 24,000 or signs of bearish reversal patterns for potential short opportunities or profit-taking.

If in position, holding might be wise until a defined breakout or breakdown occurs.

The AI Technical Analysis Center is an informational tool only and does not constitute investment or trading advice.
This site is registered on wpml.org as a development site. Switch to a production site key to remove this banner.