Generic selectors
Exact matches only
Search in title
Search in content
Post Type Selectors

Popular stocks

Crypto

CFD

Currencies

Support

Gold

NSDQ – Technical Analysis – 4h

September 12, 2025 07:00

Quick Summary

The NASDAQ 100 Index has displayed a noticeable upward movement, showcasing a bullish trend since early September. A close examination of current indicators suggests a cautiously optimistic outlook, with key breakout levels in focus.

As traders keep an eye on the market, any potential reversals should be watched closely.

Candlestick Analysis

The chart shows a recent bullish trend following a series of higher highs and higher lows, especially noticeable in the upward movement since early September.

A potential bullish engulfing pattern in early September signaled a continuation of the uptrend.

No significant bearish reversal patterns are observed at the current level.

MACD Analysis

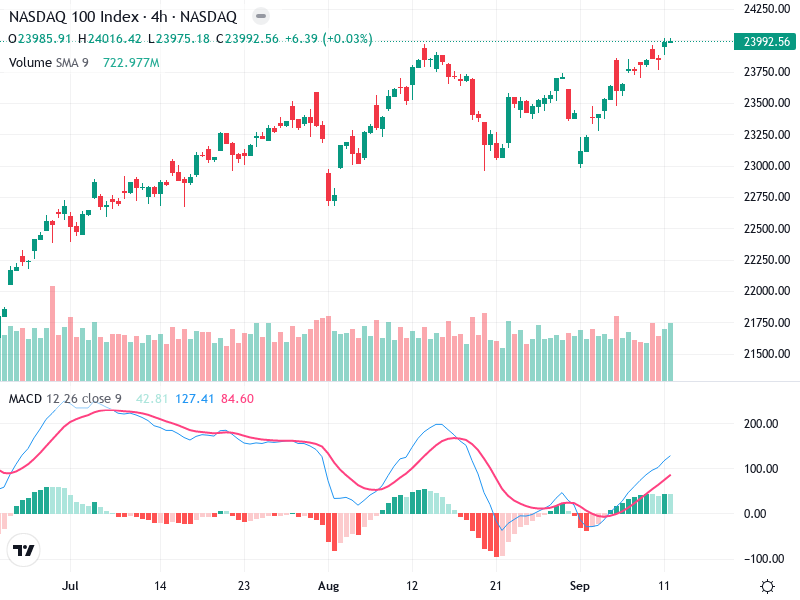
The MACD line is above the Signal line, confirming bullish momentum. This crossover suggests a continuation of the uptrend.

The positive histogram supports a bullish momentum, indicating increasing strength.

No significant divergences between MACD and price action are observed, aligning with the bullish trend.

Volume Analysis

Volume has generally supported the price movements, with higher volumes on upward days.

A few spikes in volume correlate with price increases, potentially indicating institutional buying.

There is no current contradiction between volume and price trends, supporting the current upward momentum.

Support & Resistance

Key support is identified around 23750, where previous consolidation occurred.

The current resistance to watch is at the current high of 23992.

A break above this could signal further upward movement.

Actionable Insights

Consider a buy strategy if the price breaks and closes above 23992 with strong volume.

Monitor for any bearish patterns or volume activity that could indicate a reversal.

Watch for confirmation of a breakout or failure to sustain above the resistance level as an early signal for potential trend reversal.

The AI Technical Analysis Center is an informational tool only and does not constitute investment or trading advice.
This site is registered on wpml.org as a development site. Switch to a production site key to remove this banner.