Generic selectors
Exact matches only
Search in title
Search in content
Post Type Selectors

Popular stocks

Crypto

CFD

Currencies

Support

Gold

NSDQ – Technical Analysis – 4h

September 15, 2025 07:01

Quick Summary

The NASDAQ 100 Index is exhibiting bullish momentum on the 4-hour chart. Recent analysis shows a breakout above key levels, supporting the continued upward trend. Volume analysis confirms steady buying interest supporting higher price levels.

Overall, the technical indicators favor a bullish outlook with potential for further gains.

Candlestick Analysis

Recently, there's a series of bullish candles indicating sustained upward momentum.

No major reversal patterns such as doji or hammer are immediately visible, suggesting continuation of the trend.

The breakout above 24000 serves as a key level, now acting as support.

MACD Analysis

The MACD line is above the Signal line, indicating bullish momentum.

Recent bullish crossover supports the upward trend.

No significant divergences noted; MACD aligns with the price action.

Volume Analysis

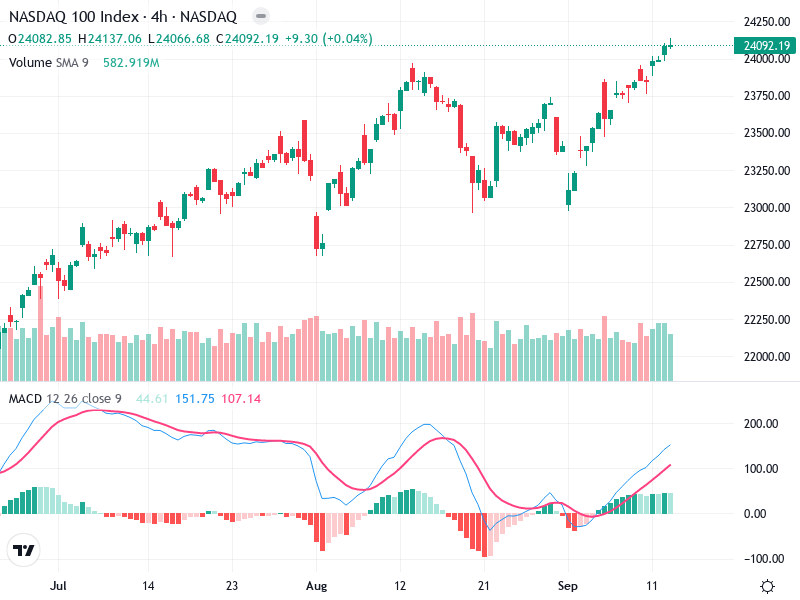
Volume has been relatively stable, with no unusual spikes, indicating steady buying interest.

Volume supports price increases; no contradiction between volume and price trend.

No major spikes, suggesting lack of aggressive institutional activity but consistent participation.

Support & Resistance

24000 is now a critical support level following the breakout.

Previous support around 23500.

Immediate resistance appears around 24200.

Actionable Insights

Consider entering long positions on pullbacks to the 24000 support level.

If already in a position, holding could be beneficial as the upward momentum is robust.

Watch for confirmation of sustained breakout above 24200 for additional buying opportunities.

The AI Technical Analysis Center is an informational tool only and does not constitute investment or trading advice.
This site is registered on wpml.org as a development site.