Generic selectors
Exact matches only
Search in title
Search in content
Post Type Selectors

Popular stocks

Crypto

CFD

Currencies

Support

Gold

NSDQ – Technical Analysis – 4h

August 21, 2025 07:00

Quick Summary

The chart shows a strong bullish trend that developed from mid-July to early August. However, a recent pullback indicates potential shifts in market dynamics.

Analyzing key technical indicators, traders can identify critical support and resistance levels.

Candlestick Analysis

The chart is showing a recent bullish trend from mid-July to early August, followed by a pullback.

The recent candlesticks indicate a potential reversal pattern with a long red candle followed by a smaller green candle, suggesting indecision.

The recent dip suggests a pullback phase, possibly testing previous support levels.

MACD Analysis

The MACD has made a bearish crossover, with the MACD line crossing below the Signal line, indicating a potential shift to bearish momentum.

The MACD histogram is negative, suggesting increasing bearish momentum.

There is no clear divergence between the MACD and the price action at this moment.

Volume Analysis

There was a spike in volume during the recent price drop, indicating strong selling pressure, possibly by institutional traders.

The high volume on the recent red candles supports the downward movement, suggesting that the pullback might be significant.

Continued high volume could reinforce the direction of the current trend.

Support & Resistance

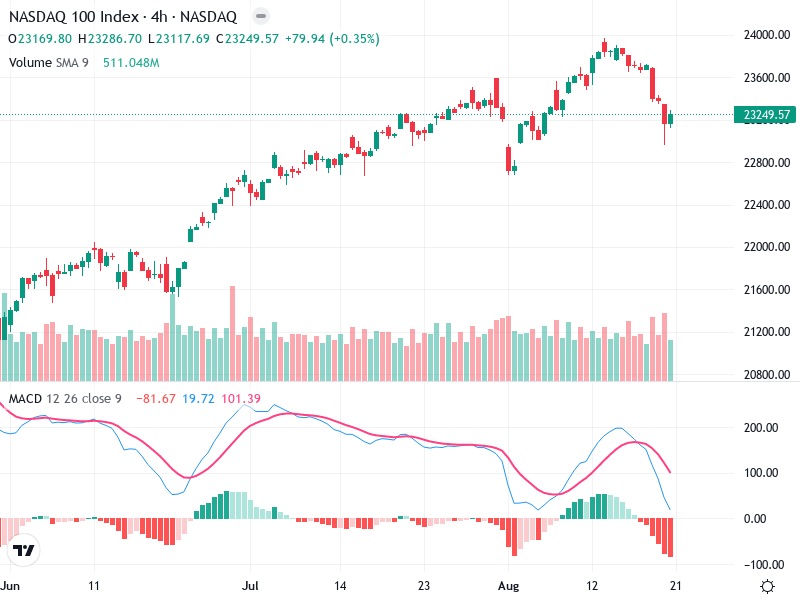
Key support can be observed around the 23,000 level, where the price might find buying interest.

Near-term resistance lies around 23,600, the recent consolidation high.

A break above the resistance could signal further bullish momentum or consolidation if faced with rejection.

Actionable Insights

Consider waiting for confirmation before buying, such as a price reversal signal like a bullish candlestick pattern or a MACD crossover back to bullish.

Monitor if the price holds the support level around 23,000 and whether the MACD starts to trend upwards.

Potential entry opportunities may arise if reversal signals align with increased buying volume.

The AI Technical Analysis Center is an informational tool only and does not constitute investment or trading advice.
This site is registered on wpml.org as a development site. Switch to a production site key to remove this banner.