Generic selectors
Exact matches only
Search in title
Search in content
Post Type Selectors

Popular stocks

Crypto

CFD

Currencies

Support

Gold

NSDQ – Technical Analysis – 4h

September 17, 2025 07:00

Quick Summary

The NASDAQ 100 demonstrates notable upward movement, evidenced by recent bullish trends.

This index has shown consistency in its upward trajectory since early September, pointing to a robust performance.

Candlestick Analysis

The NASDAQ 100 index is showing a bullish trend, moving upward consistently since early September.

Recently, the chart indicates a possible hanging man pattern at the high, which could suggest a potential reversal.

The current levels have surpassed resistance around 24000, indicating a possible breakout confirmation if sustained.

MACD Analysis

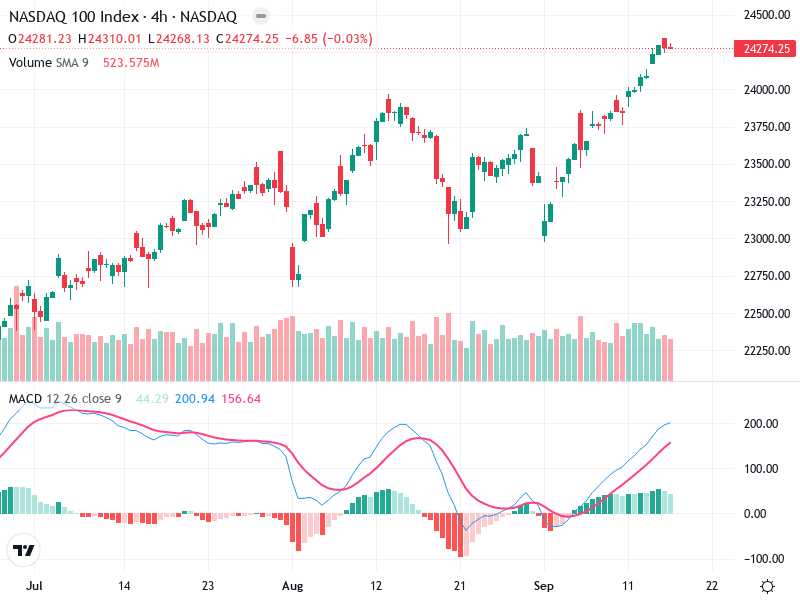
There's a recent bullish crossover, where the MACD line has crossed above the Signal line, indicating momentum in favor of bulls.

A growing positive histogram supports increasing bullish momentum, but watch for any weakening as an early indicator of slowing momentum.

Currently, there is no significant divergence observed between MACD and price action, confirming the upward trend.

Volume Analysis

Volume has been relatively stable; however, it slightly decreases as the price rises, indicating caution as a divergence could imply waning strong interest.

There are no unusual spikes indicating significant institutional activity, suggesting a lack of strong conviction by large players.

Support & Resistance

Key support level is around 23750, which was previous resistance; this level could help as a cushion in case of pullbacks.

Immediate resistance is near 24500, which is crucial to watch for either a reversal or continued momentum.

Actionable Insights

Consider buying on pullbacks near the 24000-23750 support range if bullish momentum indicators remain intact.

Current holders may continue to hold but should watch closely for signs of reversal, especially with the potential hanging man pattern.

Be mindful of potential resistance at 24500 and declining volume, which may signal a weakening trend.

The AI Technical Analysis Center is an informational tool only and does not constitute investment or trading advice.
This site is registered on wpml.org as a development site. Switch to a production site key to remove this banner.