Generic selectors
Exact matches only
Search in title
Search in content
Post Type Selectors

Popular stocks

Crypto

CFD

Currencies

Support

Gold

NSDQ – Technical Analysis – 4h

September 18, 2025 07:00

Quick Summary

The asset is showing a strong bullish trend with higher highs and higher lows.

The current market sentiment is positive, supported by increased volume at recent highs.

Candlestick Analysis

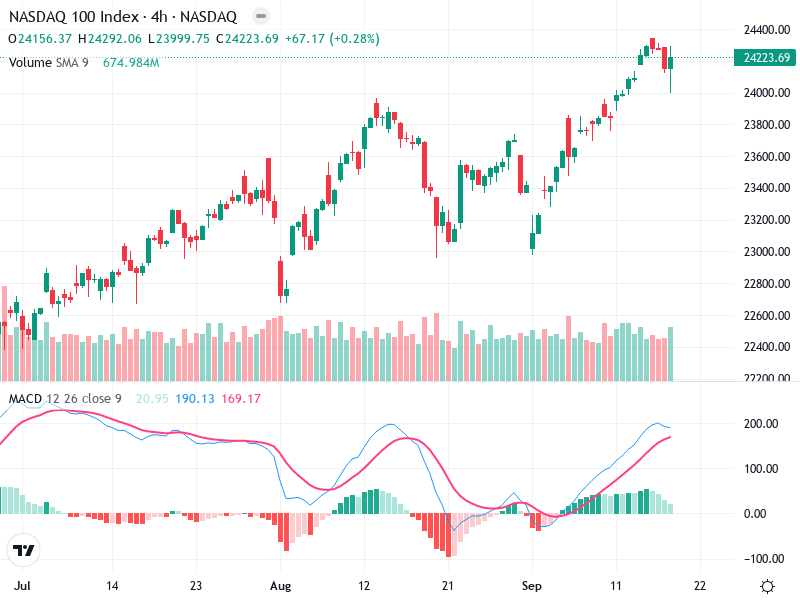
The overall trend is bullish, with a series of higher highs and higher lows.

Recently, there’s a candlestick with a long upper shadow near the current price level, indicating selling pressure at the higher price points, which may suggest a potential pullback.

The recent pullback from a peak around 24,400 suggests this level may act as resistance in the near term.

MACD Analysis

The MACD line is above the Signal line, showing a recent bullish crossover, indicating upward momentum.

The histogram is positive, but the bars are decreasing, possibly suggesting weakening bullish momentum.

There’s no clear divergence between MACD and price visible, supporting the current price action.

Volume Analysis

There’s a noticeable increase in volume during the recent price highs, which suggests active participation and possibly some profit-taking.

Increasing volume on upward movements typically indicates strong bullish sentiment supported by increased investor confidence.

The significant volume at recent highs could indicate institutional activity or profit-taking, as inferred from the accompanying pullback.

Support & Resistance

Around 23,800 is a previous consolidation zone that may provide support if the price pulls back.

The 24,400 level has shown resistance with the recent rejection, marking it as a critical level for future breakouts.

Actionable Insights

Consider buy positions if the price can break and sustain above the 24,400 resistance level with increasing volume for confirmation.

If bearish patterns emerge while approaching resistance levels, it might be prudent to hold or sell short-term positions to capitalize on a pullback.

Monitor if the MACD histogram continues to weaken, as it might confirm decreasing momentum and a potential reversal.

The AI Technical Analysis Center is an informational tool only and does not constitute investment or trading advice.
This site is registered on wpml.org as a development site. Switch to a production site key to remove this banner.