Generic selectors
Exact matches only
Search in title
Search in content
Post Type Selectors

Popular stocks

Crypto

CFD

Currencies

Support

Gold

NSDQ – Technical Analysis – 4h

September 25, 2025 07:00

Quick Summary

The NASDAQ 100 Index has been displaying a robust bullish trend with consistent higher highs and higher lows.

Recent market activity suggests a potential for consolidation or a pullback, requiring cautious observation.

Candlestick Analysis

The index has shown a strong bullish trend, with higher highs and higher lows observed in recent sessions.

There is a series of red candlesticks near the recent highs, suggesting a potential pullback or consolidation phase.

The recent candlestick is a smaller red body, indicating indecision or potential reversal.

MACD Analysis

The MACD line is above the Signal line, but they are converging, suggesting weakening bullish momentum.

The histogram is starting to decline, indicating reduced momentum and a potential bearish crossover if the trend continues.

No significant divergence between MACD and price action is apparent, reinforcing the current weakening momentum.

Volume Analysis

There is an increase in volume during the recent selling phase, which supports the validity of this pullback.

A noticeable spike in volume occurred with the recent pullback, potentially indicating institutional activity or a shift in market sentiment.

The overall trading volume activity corroborates the current market sentiments.

Support & Resistance

Strong resistance is around the 24,750-25,000 zone as noted.

Key support is around the 24,000 level, where previous pullbacks have stabilized.

Monitoring these levels will be essential for gauging future price movements.

Actionable Insights

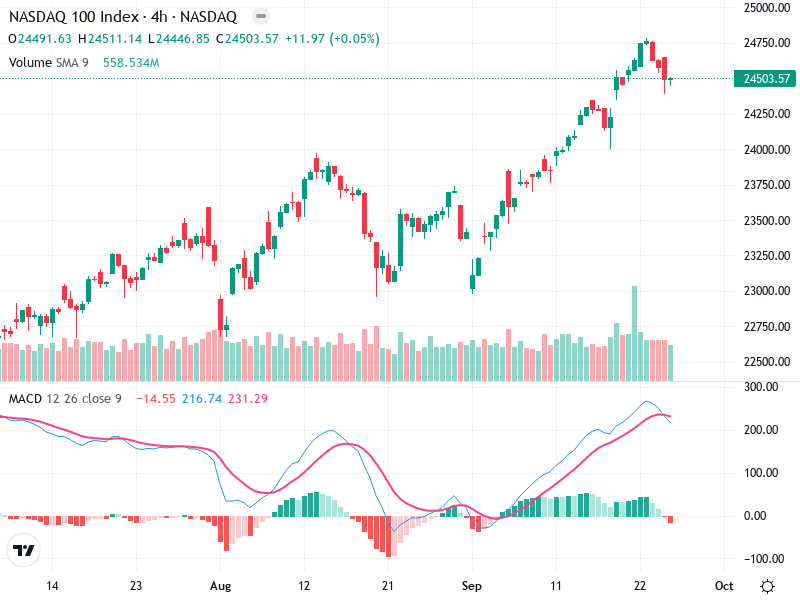
Hold: Given the current pullback, a wait-and-see approach might be prudent until a clearer direction is established.

Potential Buy: A bullish reversal pattern or increased momentum above the 24,750 level could signal a buying opportunity.

Potential Sell: If price breaks below the 24,000 support with high volume, this might indicate further downside potential.

The AI Technical Analysis Center is an informational tool only and does not constitute investment or trading advice.
This site is registered on wpml.org as a development site. Switch to a production site key to remove this banner.