Generic selectors
Exact matches only
Search in title
Search in content
Post Type Selectors

Popular stocks

Crypto

CFD

Currencies

Support

Gold

NSDQ – Technical Analysis – 4h

August 22, 2025 07:00

Quick Summary

The chart exhibits a marked shift in trend, transitioning from a prolonged uptrend to a recent downtrend.

The bearish sentiment is evident with increased selling pressure observed through key technical indicators.

Candlestick Analysis

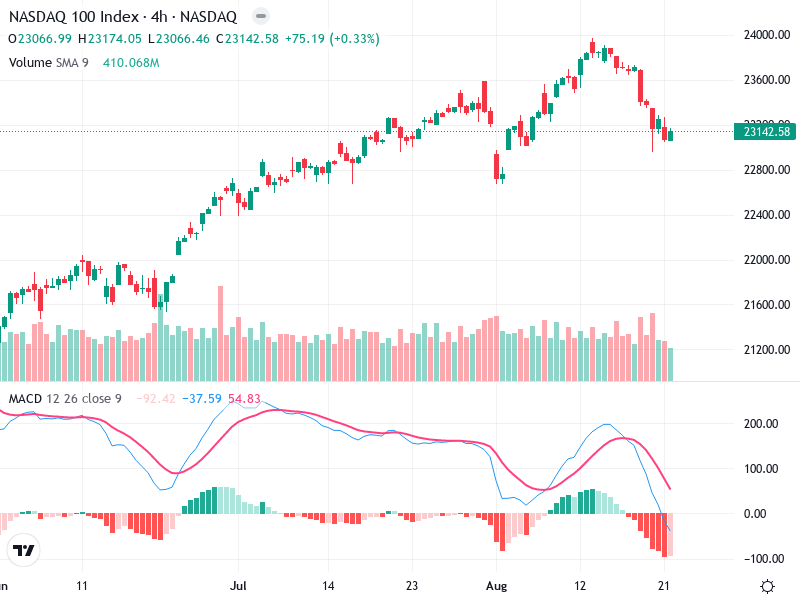
There appear to be several notable patterns, including a potential bearish engulfing pattern visible before the recent downtrend. This indicates a potential reversal after an uptrend.

The chart shows a recent downtrend following a long uptrend, shifting the sentiment from bullish to bearish.

The price around 23,000 acts as a recent support zone. A clear break below this could signal further downside.

MACD Analysis

The MACD line is below the Signal line, indicating bearish momentum. This crossover suggests continuing downward pressure.

The histogram is negative, reinforcing the bearish sentiment with increasing momentum to the downside.

No clear divergence is visible between MACD and price action, supporting the ongoing trend.

Volume Analysis

There is an increase in volume during down moves, indicating strong selling interest.

Higher volume on recent down days supports the price movement, validating the bearish trend.

The spike in volume may suggest institutional selling, confirming the bearish move.

Support & Resistance

The price around 23,000 is acting as a key support level.

Recent highs near 24,000 serve as strong resistance.

A break below 23,000 could lead to more selling, while holding above supports potential stabilization.

Actionable Insights

Consider shorting if the price breaks below the 23,000 support with confirmation.

If holding, watch for signs of stabilization or bullish reversal patterns before adding more.

Confirmation signals include sustained trading below 23,000 or a bullish reversal pattern like a hammer.

The AI Technical Analysis Center is an informational tool only and does not constitute investment or trading advice.
This site is registered on wpml.org as a development site. Switch to a production site key to remove this banner.