Generic selectors
Exact matches only
Search in title
Search in content
Post Type Selectors

Popular stocks

Crypto

CFD

Currencies

Support

Gold

NSDQ – Technical Analysis – 4h

August 25, 2025 07:00

Quick Summary

The chart of NASDAQ 100 Index reveals an ongoing uptrend dating back to mid-July, indicating a generally bullish trend.

However, recent minor pullbacks suggest potential consolidation phases, requiring close monitoring of key levels for confirmation.

Candlestick Analysis

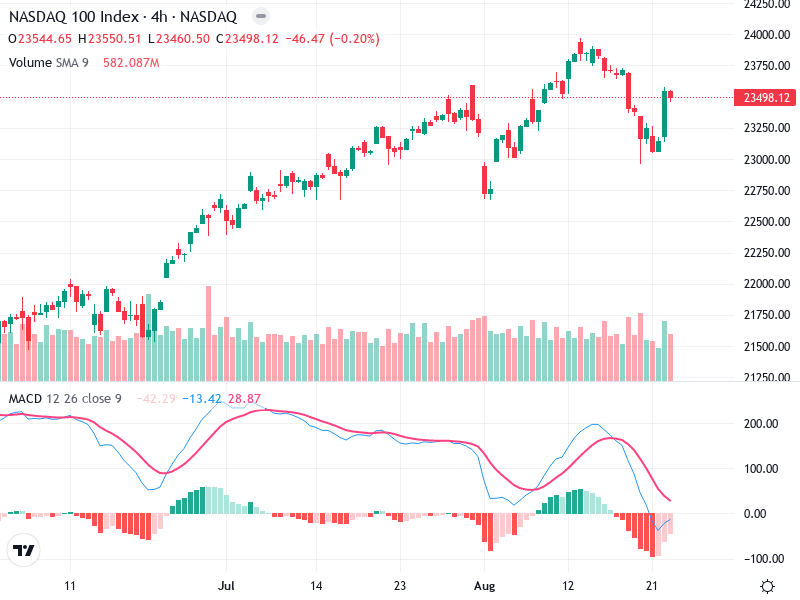
The chart displays an overall uptrend since mid-July, although recent minor pullbacks hint at possible consolidation.

A strong bearish candle followed by smaller bullish candles hints at market indecision, suggesting either a reversal or continuation.

The zone around 23,750 acts as resistance, with 23,100 serving as support.

MACD Analysis

The MACD line falling below the signal line marks a bearish crossover, supporting a short-term bearish outlook.

A negative MACD histogram shows diminishing downward momentum, indicating potential easing of bearish pressure.

The absence of divergence between MACD and price action reflects stable momentum.

Volume Analysis

Increased volume during recent pullbacks points to strong selling pressure, suggesting a distribution phase.

The volume spike aligns with recent bearish price movements and supports the observed decline.

Lack of notable volume spikes implies normal market activity without significant institutional interference.

Support & Resistance

Resistance is significant around 23,750, a recurring hurdle for prices.

The 23,100 level remains key immediate support, with a breach hinting at potential downside.

Monitoring these levels is crucial for anticipating future price movements.

Actionable Insights

Trading Strategy:

Consider buying if price breaks above 23,750 with strong supporting volume.

Short positions are viable if price falls below 23,100, reinforcing bearish MACD signals.

Monitor for clearer direction, especially a MACD breakout or divergence, before initiating new trades.

The AI Technical Analysis Center is an informational tool only and does not constitute investment or trading advice.
This site is registered on wpml.org as a development site. Switch to a production site key to remove this banner.