Generic selectors
Exact matches only
Search in title
Search in content
Post Type Selectors

Popular stocks

Crypto

CFD

Currencies

Support

Gold

NSDQ – Technical Analysis – 4h

October 23, 2025 07:01

Quick Summary

The NASDAQ 100 Index is analyzed on a 4-hour chart, showing significant movements over the past month. Recent signals indicate a bullish trend with potential for upward movement.

The analysis includes detailed insights into candlestick patterns, MACD crossovers, and volume changes, providing a comprehensive view of potential market directions.

Candlestick Analysis

The overall trend from mid-September to mid-October is bullish, as evidenced by a series of higher highs and higher lows.

Recently, we can see a bullish engulfing pattern suggesting a potential reversal or continuation of the uptrend.

Near the 25,000 level, a breakout zone was tested but did not hold, leading to the recent pullback.

MACD Analysis

The MACD line is below the signal line, indicating a recent bearish crossover; however, they are converging again, suggesting potential for a bullish crossover.

The MACD histogram is showing decreasing bearish momentum, which might indicate a shift in trend.

There is no clear divergence between the MACD and price action at this time.

Volume Analysis

Volume has been relatively stable with occasional spikes.

Notably, a spike occurred during a period of price weakness, suggesting potential institutional involvement or profit-taking.

Recent upward price move was accompanied by decreasing volume, which may suggest a lack of strong buying interest. This could necessitate confirmation for continuation.

Support & Resistance

Around 24,500, a support zone can be identified where price has previously bounced.

The recent high near 25,250 serves as a resistance level.

Breaking above 25,250 with strong volume could confirm continuation of the uptrend.

Actionable Insights

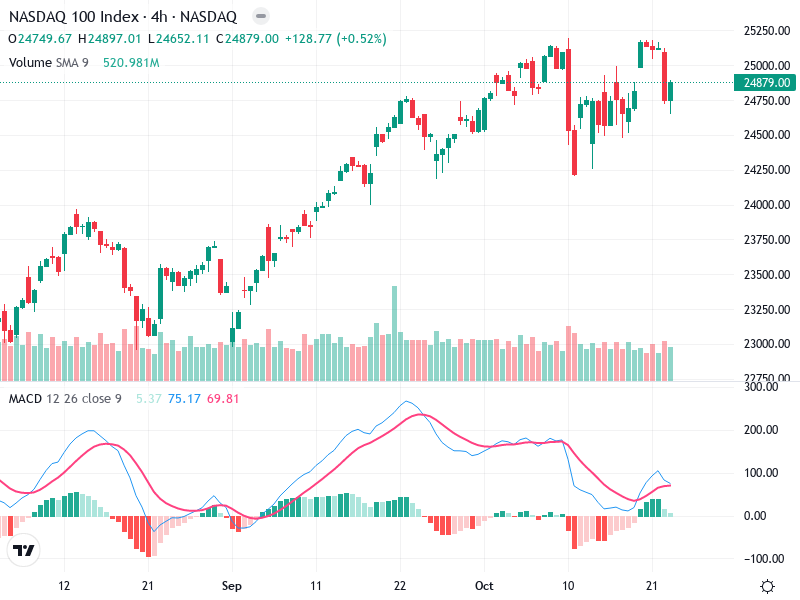
Consider buying on a confirmed breakout above 25,250 with supporting volume, or near the support level of 24,500 if buying signals emerge.

If the price fails to break above the resistance and the MACD turns bearish, it may be prudent to lock in profits or set stop-losses.

Holding is advisable if the price consolidates above 24,500, indicating accumulation before a potential breakout.

The AI Technical Analysis Center is an informational tool only and does not constitute investment or trading advice.
This site is registered on wpml.org as a development site. Switch to a production site key to remove this banner.