Generic selectors
Exact matches only
Search in title
Search in content
Post Type Selectors

Popular stocks

Crypto

CFD

Currencies

Support

Gold

NSDQ – Technical Analysis – 4h

November 3, 2025 08:00

Quick Summary

The NASDAQ 100 index has shown a strong bullish trend recently, breaking above key resistance levels.

The asset has made a series of higher highs and higher lows indicating continued upward momentum.

Candlestick Analysis

The NASDAQ 100 index exhibits a bullish trend with a series of higher highs and higher lows from late September through October.

Recently, there appears to be a doji or small-bodied candle near the top, suggesting potential indecision or a pause in the current uptrend.

The index recently broke above the 25600 level, which could serve as a new support if the price holds above.

MACD Analysis

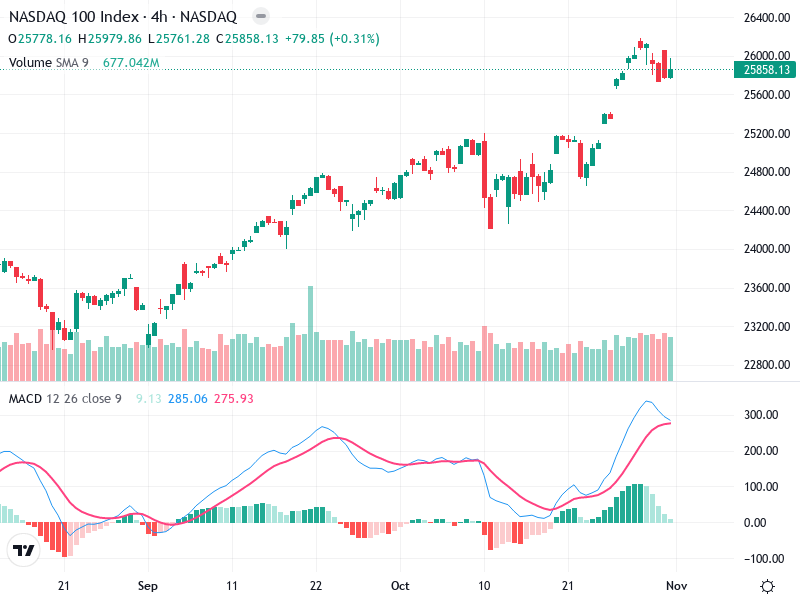
The MACD line is above the Signal line, indicating bullish momentum. However, the two lines appear to be converging, which may suggest weakening momentum.

The histogram shows decreasing bullish momentum as the bars are shortening, indicating potential for a slowdown or reversal in bullish strength.

No significant divergences currently between price action and the MACD line that would indicate immediate shifts.

Volume Analysis

Volume spiked significantly during the recent upward movement, supporting the bullish trend. However, it has decreased slightly, indicating reduced buying pressure.

The previous volume spikes around major price movements could suggest institutional buying, especially during breakouts.

Support & Resistance

Key support is around 25600, aligning with the breakout level.

The immediate resistance is near 26000, the round number psychological level recently tested.

Actionable Insights

Consider buying if the index pulls back to the 25600 level and shows bullish confirmation, like a bounce with a strong green candle and increased volume.

Watch for bearish divergence in MACD or a candlestick pattern indicating reversal at resistance levels for potential profit-taking if currently holding.

Current holders might wait for signs of a clear reversal before selling, especially if the price stays above support levels.

The AI Technical Analysis Center is an informational tool only and does not constitute investment or trading advice.
This site is registered on wpml.org as a development site. Switch to a production site key to remove this banner.