Generic selectors
Exact matches only
Search in title
Search in content
Post Type Selectors

Popular stocks

Crypto

CFD

Currencies

Support

Gold

NSDQ – Technical Analysis – 4h

November 7, 2025 08:01

Quick Summary

The NASDAQ 100 chart currently reflects a bearish sentiment with recent downturns. The asset has seen a dominant presence of red candlesticks, indicating a shift from the previous upward trend. Moreover, the MACD analysis supports this bearish perspective.

Volume analysis suggests strong selling pressure, with increased activity during the downturn. It’s crucial to monitor the key support and resistance levels to anticipate potential rebounds or further declines.

Candlestick Analysis

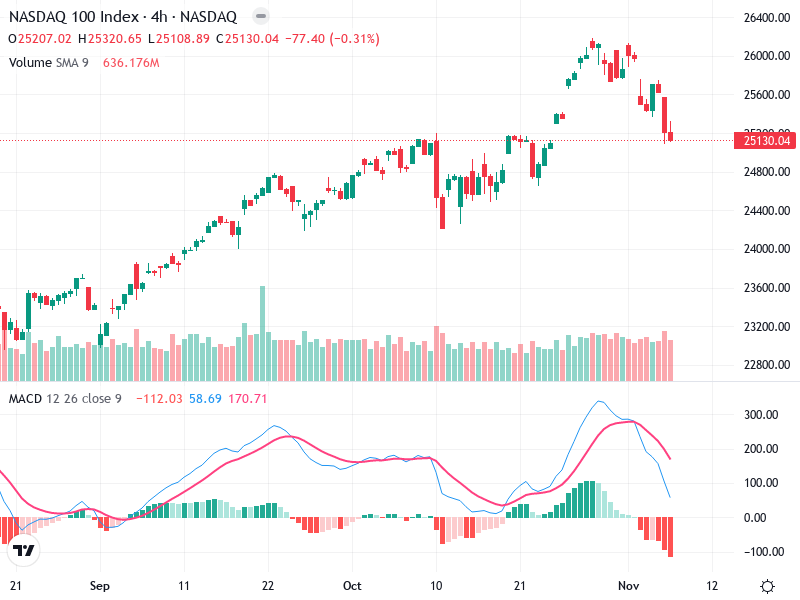
The chart shows a recent bearish trend with red candlesticks dominating the last few sessions. Before the downturn, there was a clear bearish engulfing pattern, indicating potential reversal from the uptrend.

The trend has shifted to bearish in the short term after a steady climb. The recent drop suggests the beginning of a correction phase.

There is a potential pullback at the 25,000 level, which appears to be a psychological and technical support zone.

MACD Analysis

The MACD line has crossed below the Signal line, indicating a bearish crossover. This suggests increasing negative momentum.

The histogram is showing increasing negative values, reinforcing the bearish momentum.

No significant divergences observed currently, as both price action and MACD are aligned in bearish sentiment.

Volume Analysis

Volume increased during the recent downturn, suggesting strong selling pressure which aligns with the bearish price movement.

The rise in volume on down days supports the bearish price action.

A notable spike in volume occurred with the downward movement, pointing towards possible institutional selling.

Support & Resistance

Around 25,000, providing a critical level to watch for potential rebounds or further breakdowns.

Near 25,600, the recent peak before the downturn, marking significant resistance for any bullish attempts.

Monitoring these levels can help in deciding whether the market will face a short-term reversal or continuation of the current trend.

Actionable Insights

Considering the bearish indicators, there is potential for shorting if the price breaks below the 25,000 support decisively.

For long-term positions, monitoring the support levels is essential, with potential holds if price stabilizes.

Watch for any reversal patterns like bullish engulfing or hammer at support levels for potential buying signals.

The AI Technical Analysis Center is an informational tool only and does not constitute investment or trading advice.
This site is registered on wpml.org as a development site. Switch to a production site key to remove this banner.