Generic selectors
Exact matches only
Search in title
Search in content
Post Type Selectors

Popular stocks

Crypto

CFD

Currencies

Support

Gold

NSDQ – Technical Analysis – 4h

November 11, 2025 08:00

Quick Summary

The asset’s recent price movement suggests a potentially bullish trend as observed through key technical indicators. Notable patterns and volume changes lend support to the outlook.

The asset has seen significant activity with potential for further gains if current trends continue.

Candlestick Analysis

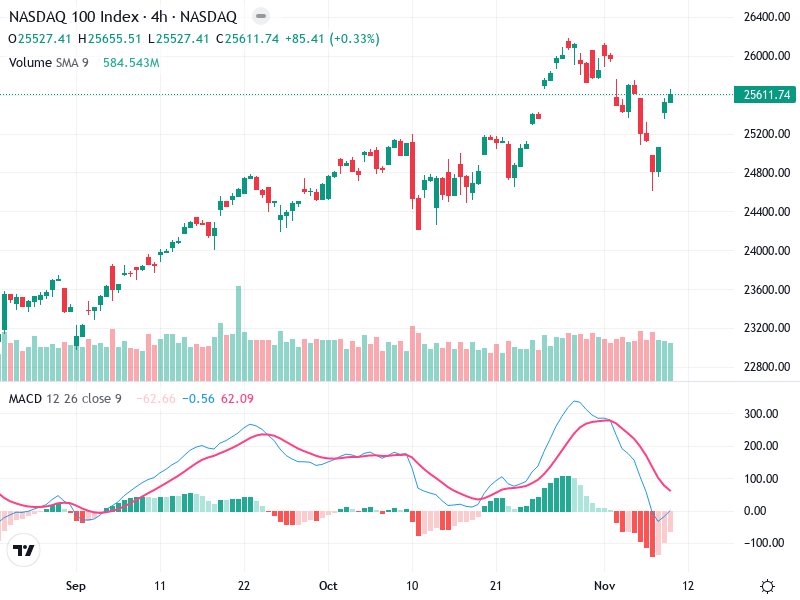
A bullish engulfing pattern has recently appeared, indicating potential upward momentum and a possible reversal from the recent downtrend.

The chart reveals a bullish phase during September and October with a significant pullback interruption, though recent bullish candles suggest a possible recovery.

There is a confirmed breakout above 25,200, indicating the potential for continued upward movement, and staying above this level may signal the end of the pullback phase.

MACD Analysis

The MACD line is nearing a bullish crossover with the Signal line, signaling potential upward momentum.

The MACD histogram is turning positive, which suggests increasing bullish momentum.

No clear divergence is currently noted, as the MACD movement aligns with price action.

Volume Analysis

There is a noticeable spike in volume accompanying recent bullish candles, which confirms the upward movement.

The increase in volume supports the recent price rise, indicating strong buying interest.

The volume surge during the bullish engulfing pattern could potentially indicate institutional buying activity.

Support & Resistance

Key support is around 25,200, a former resistance level, providing a critical zone for monitoring.

Immediate resistance is near 26,000, and breaking above this could lead to further gains.

These levels are crucial for monitoring potential breakouts or reversals.

Actionable Insights

Consider a buy strategy if the asset holds above the 25,200 level, with a target above 26,000.

Look for confirmation of the MACD bullish crossover and sustained volume increases for continued upward momentum.

A failure to break 26,000 might result in a retest of lower support levels.

The AI Technical Analysis Center is an informational tool only and does not constitute investment or trading advice.
This site is registered on wpml.org as a development site. Switch to a production site key to remove this banner.