The NASDAQ 100 Index is currently witnessing a bearish trend, as evidenced by its technical indicators. Its recent performance on the 4-hour chart shows a series of lower highs and lows, which suggests ongoing downward pressure.
Important support and resistance levels are at play, which could dictate future movement.
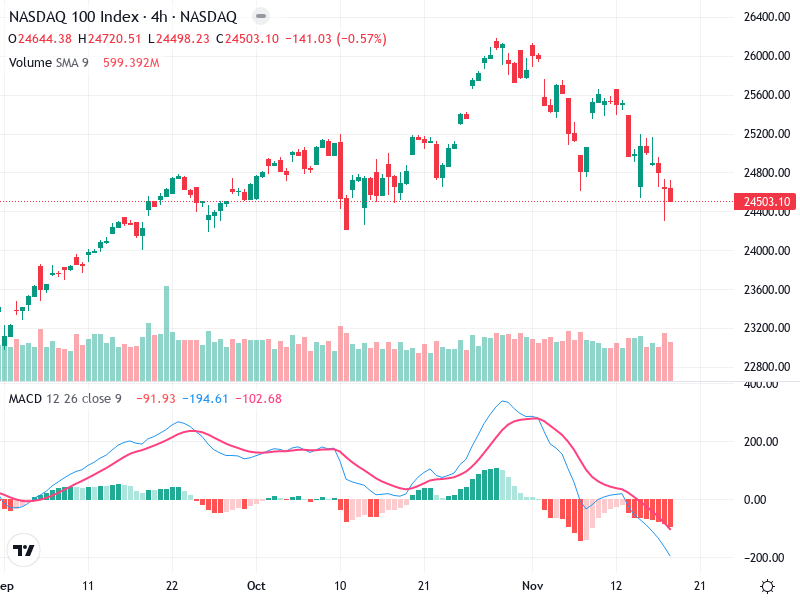
Candlestick Analysis
The current trend appears bearish, with lower highs and lows since early November.
Recent candlesticks with long upper wicks suggest selling pressure and potential for further decline.
The index broke support at 24,800, indicating possible continued decline unless reclaimed.
MACD Analysis
The MACD line remains below the Signal line, continuing a bearish trend.
The histogram shows increasing negative values, strengthening bearish momentum.
No divergence observed between MACD and price action, supporting the ongoing downtrend.
Volume Analysis
Volume increases during price declines indicate strong selling interest.
The volume on down days supports the bearish trend.
Significant trading activity confirms the move lower.
Support & Resistance
A key support level is at 24,400, now being tested, with risks of further decline if breached.
Resistance is at 24,800, the prior support level now restricting upward movement.
Breaking above 24,800 is necessary for any bullish reversal.
Actionable Insights
A cautious strategy with potential short opportunities below 24,800 is advisable.
Watch for confirmation of reversal patterns and bullish MACD crossover.
A close above 24,800 could signal a potential trend change.
The AI Technical Analysis Center is an informational tool only and does not constitute investment or trading advice.