Generic selectors
Exact matches only
Search in title
Search in content
Post Type Selectors

Popular stocks

Crypto

CFD

Currencies

Support

Gold

NSDQ – Technical Analysis – 4h

November 20, 2025 08:01

Quick Summary

The NASDAQ 100 Index chart reflects recent market activities and potential directional shifts.

Key levels and indicators provide insights into upcoming movements.

Traders can gain valuable insights from this 4-hour analysis.

Candlestick Analysis

The chart shows a recent downtrend, with lower highs and lower lows suggesting bearish momentum.

There's a potential bullish engulfing pattern near the current price, indicating a possible reversal to the upside if confirmed.

Recent attempts to break below 24400 were met with buying interest, indicating a possible support zone.

MACD Analysis

The MACD line is below the Signal line, but they are converging, suggesting a potential bullish crossover might occur soon if momentum shifts.

The histogram is negative but is decreasing in size, indicating waning bearish momentum and a potential shift towards bullish momentum.

No significant divergences observed at this time.

Volume Analysis

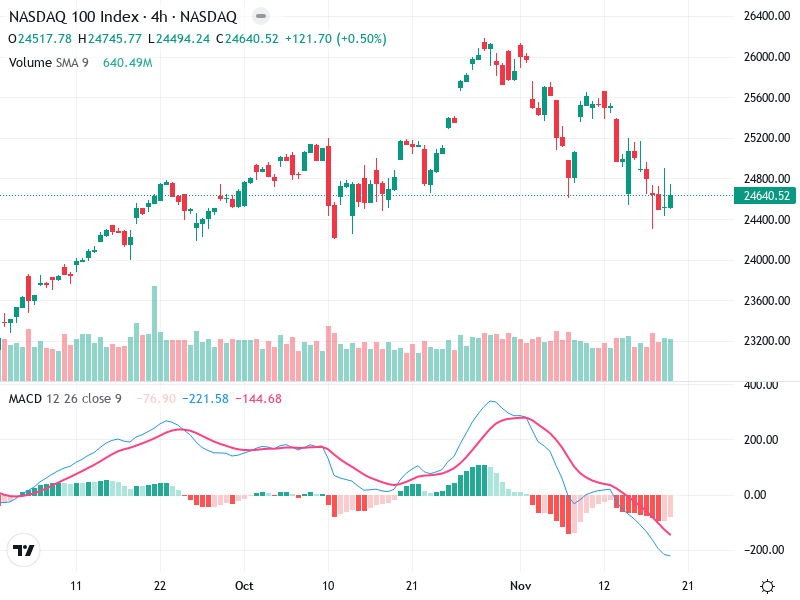
Volume shows spikes during price drops, suggesting stronger selling pressure during downtrends.

Recent volume decreases coincide with consolidation, which could indicate a slowing of bearish momentum.

No extreme irregular volume surge indicating institutional activity; however, watch for any volume spikes near resistance levels.

Support & Resistance

Support around 24400, as evidenced by repeated tests without significant breakdown.

Resistance around 25200 to 25400, aligning with previous price peaks where selling occurred.

Traders should monitor these levels closely for potential breakouts or reversals.

Actionable Insights

Consider buying if the MACD crossover is confirmed with increasing volume and a bullish candlestick pattern near the support level.

Watch for reversal signs near resistance levels for shorting opportunities.

If already long, monitor for potential resistance breakout confirmation before expanding positions.

The AI Technical Analysis Center is an informational tool only and does not constitute investment or trading advice.
This site is registered on wpml.org as a development site. Switch to a production site key to remove this banner.