Generic selectors
Exact matches only
Search in title
Search in content
Post Type Selectors

Popular stocks

Crypto

CFD

Currencies

Support

Gold

NSDQ – Technical Analysis – 4h

December 8, 2025 08:00

Quick Summary

This technical analysis provides insights into the Asset’s current market condition. The Asset is currently displaying a bullish trend, supported by key technical indicators. Observations suggest potential trading opportunities.

Candlestick Analysis

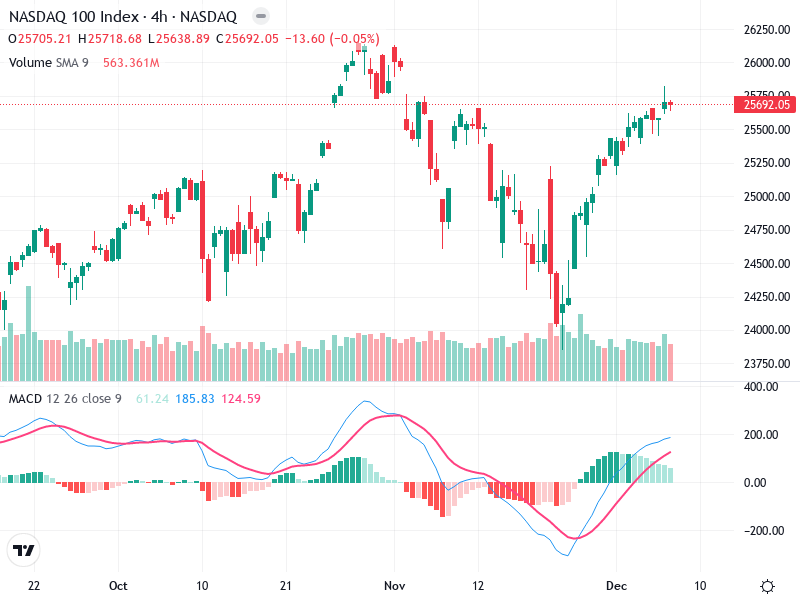
The chart demonstrates a bullish trend recovery after a notable dip. The price action shows a series of higher highs and higher lows, indicating upward momentum.

Recently, there seems to be a formation of bullish patterns as the price rises. A notable pattern earlier is the large bullish candlestick following a downtrend, hinting at potential reversal.

The price has approached a resistance level around the 25,750 mark, testing it for a potential breakout.

MACD Analysis

The MACD line is above the Signal line, indicating a bullish crossover. This reflects increasing upward momentum.

The histogram bars are positive and rising, supporting the bullish trend.

No significant divergences detected at this point between MACD and price action, suggesting potential trend continuation.

Volume Analysis

There have been notable increases in volume on uptrend days, validating the current bullish move.

The volume supports the upward price movement, indicating strong buying interest.

There are no extreme spikes suggesting disproportionate institutional activity, but steady volume supports the upward trend.

Support & Resistance

The immediate resistance is around the 25,750 level. A sustained breakout above this could signal further bullish momentum.

Key support levels can be observed around the 24,800 and 25,000 zones, where recent consolidations occurred.

Actionable Insights

Consider entering long positions if there is a confirmed breakout above 25,750 with strong volume support.

Watch for potential bearish patterns or a MACD bearish crossover as signals to exit or hold back before further buying.

Monitor for a potential reversal pattern or failure to break above resistance as cautionary signals.

The AI Technical Analysis Center is an informational tool only and does not constitute investment or trading advice.
This site is registered on wpml.org as a development site. Switch to a production site key to remove this banner.