Generic selectors
Exact matches only
Search in title
Search in content
Post Type Selectors

Popular stocks

Crypto

CFD

Currencies

Support

Gold

NSDQ – Technical Analysis – 4h

December 10, 2025 08:00

Quick Summary

The NASDAQ 100 Index is displaying a mix of consolidation and potential breakout signals on its 4-hour chart.

The asset has shown a recent bullish recovery but faces resistance at higher levels.

Candlestick Analysis

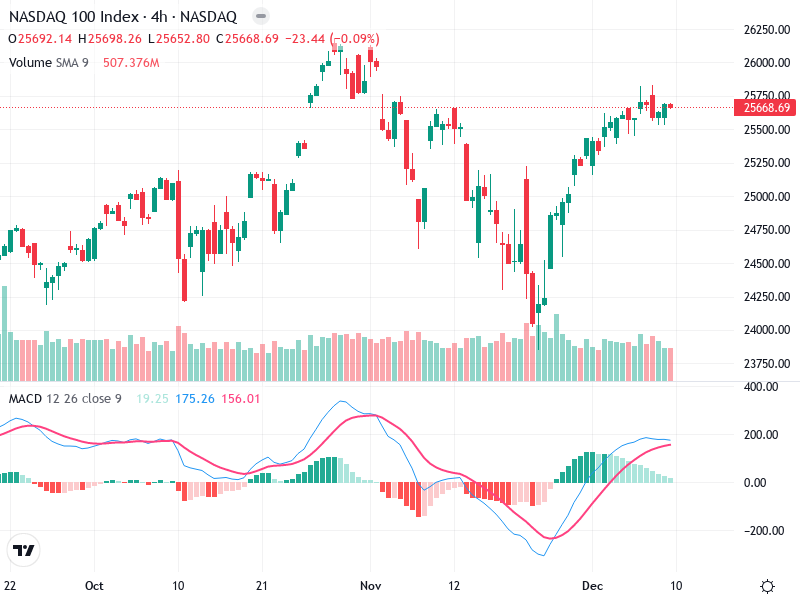
Recent candlesticks show small-bodied candles indicating indecision, typical of a doji-like pattern which can suggest a potential pause or reversal in price action.

The trend in recent weeks shows a bullish recovery from a previous downtrend. However, the recent consolidation suggests potential resistance at current levels.

The area around 25,750 is acting as a resistance zone with several attempts to break higher. A breakout above this level could resume the upward momentum, while a pullback might retest the support around 24,750.

MACD Analysis

MACD Line (blue) is above the Signal Line (red), indicating a bullish crossover that occurred earlier. This supports the bullish momentum seen recently.

The histogram shows decreasing momentum as the bars are shortening, suggesting that the bullish momentum is weakening.

No clear divergences between MACD and price are observable in the current chart setup.

Volume Analysis

Volume has decreased as the price consolidated near resistance, typical in consolidation phases before a potential breakout or reversal.

The decreasing volume as the price rises could suggest weakening demand at higher levels, indicating caution.

No unusual volume spikes indicating significant institutional activity at present.

Support & Resistance

Resistance is at approximately 25,750, where price consolidation is evident.

Support is around 24,750, which marked the recent base for the upward rally.

Actionable Insights

Consider buying on a confirmed breakout above 25,750 on increased volume for continuation of bullish trend.

Consider selling or reducing positions if the price fails to break above resistance and reverses with increased selling volume.

Current holders may watch for a confirmed breakout above resistance or a reversal at support levels to decide further action.

The AI Technical Analysis Center is an informational tool only and does not constitute investment or trading advice.
This site is registered on wpml.org as a development site. Switch to a production site key to remove this banner.