Generic selectors
Exact matches only
Search in title
Search in content
Post Type Selectors

Popular stocks

Crypto

CFD

Currencies

Support

Gold

NSDQ – Technical Analysis – 4h

December 11, 2025 08:00

Quick Summary

The NASDAQ 100 Index 4H chart showcases recent bullish momentum. A significant breakout could signal further upward movement. The asset displays a recovery pattern, with higher highs and higher lows observed.

Candlestick Analysis

Recently, a bullish engulfing pattern is visible, indicating potential upward momentum.

The trend shows a recovery from a previous bearish pattern to a bullish movement, evidenced by higher highs and higher lows.

The recent price action is testing a previous high around 25,600. If a breakout occurs, it may signal further bullish momentum.

MACD Analysis

The MACD line is slightly above the signal line, suggesting a bullish crossover.

The histogram is positive, showing strong upward momentum, but it's starting to show some decrease in height, which could indicate a slowing momentum.

There's no clear divergence between MACD and price action, supporting the current price movement.

Volume Analysis

There has been a notable increase in volume in the recent uptrend, supporting the bullish price movement.

The rise in price accompanied by increased volume indicates strong buying interest.

A recent spike suggests possible institutional buying, particularly at the recent lows.

Support & Resistance

Key support is around 25,000, where multiple bounces have occurred in the past.

The index is currently facing resistance at 25,600. A break above this could lead to further advances.

Actionable Insights

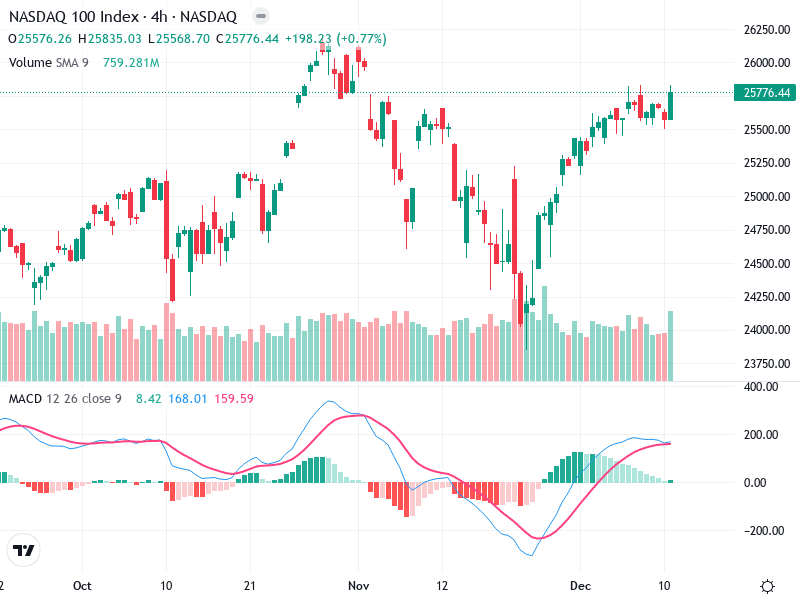
Consider buying if the price breaks and closes above 25,600 with strong volume and a continued bullish MACD crossover.

If unable to break through resistance, you might consider selling or shorting, especially if the MACD begins to turn downwards and volume decreases.

Holding could be suitable if already in a position, given the current uptrend, but watch for any reversal signals.

The AI Technical Analysis Center is an informational tool only and does not constitute investment or trading advice.
This site is registered on wpml.org as a development site. Switch to a production site key to remove this banner.