Generic selectors
Exact matches only
Search in title
Search in content
Post Type Selectors

Popular stocks

Crypto

CFD

Currencies

Support

Gold

NSDQ – Technical Analysis – 4h

December 12, 2025 08:00

Quick Summary

The NASDAQ 100 Index has exhibited a mix of trends recently. After experiencing a downtrend, there was a notable recovery.

Currently, the index is consolidating around a key level, which could predict future movements.

Candlestick Analysis

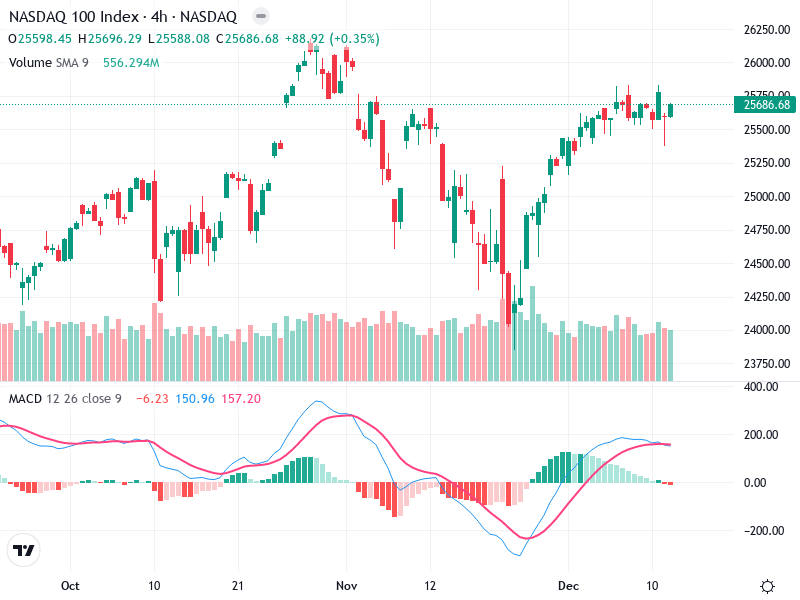
The index experienced a recent downtrend followed by a strong recovery. Currently, it appears to be in a consolidation phase around the 25,586 level.

Look for potential reversal patterns like hammers or dojis, which can indicate a change in sentiment. No significant single candlestick patterns are evident in the provided chart.

The level around 25,600 acts as a potential resistance zone, with past attempts unable to sustain a breakout. A decisive breakout above this level with volume can signal further bullish momentum.

MACD Analysis

The MACD line has recently crossed above the Signal line, indicating a bullish crossover, suggesting upward momentum.

The positive histogram supports the bullish crossover, but the decreasing size points to weakening momentum. Watch for reversals or flattening.

There is no clear bullish or bearish divergence between MACD and price action at this time.

Volume Analysis

Recent uptrends are supported by increasing volume, which is a positive sign of strength behind the move.

The rising volume during the recent bullish moves supports the price action and suggests buying interest.

Look for any significant spikes concurrent with price breaks that could suggest institutional activity.

Support & Resistance

Around 25,600 is a key short-term resistance. A breakout above this with volume could lead to a stronger bullish move.

Near-term support is visible around the 24,750 level. A drop below this could signal potential bearish sentiment.

The index is consolidating near these levels, which could predict future movements.

Actionable Insights

Consider buying on a confirmed breakout above 25,600 with sustained volume, as it could indicate further bullish momentum.

If the index fails at resistance and falls with volume, consider short positions or profit-taking for long trades near resistance levels.

If uncertainty persists, holding until clearer signals emerge could be prudent, particularly for long-term positions.

The AI Technical Analysis Center is an informational tool only and does not constitute investment or trading advice.
This site is registered on wpml.org as a development site. Switch to a production site key to remove this banner.