Generic selectors
Exact matches only
Search in title
Search in content
Post Type Selectors

Popular stocks

Crypto

CFD

Currencies

Support

Gold

NSDQ – Technical Analysis – 4h

December 19, 2025 08:01

Quick Summary

The NASDAQ 100 is currently experiencing a period of indecision, as evidenced by recent market patterns.

Though there is potential bearish sentiment, key resistance levels continue to hold sway over the index movements.

Analyzing various indicators provides insight into potential future trends for the asset.

Candlestick Analysis

There is a noticeable bearish engulfing pattern in early December, indicating potential bearish sentiment.

Recent candlesticks show some doji formations, suggesting indecision in the market.

The trend appears to be sideways with a bearish tilt, as seen in the recent price action moving lower after a peak.

MACD Analysis

The MACD line is below the Signal line, indicating a bearish crossover has occurred.

The histogram is in negative territory and slightly increasing towards zero, suggesting weakening bearish momentum.

There are no significant divergences observed between MACD movement and price action currently.

Volume Analysis

There was an increase in volume during the recent decline, suggesting strong selling pressure.

The increase in volume supports the recent downward price action, indicating conviction behind the move.

Institutional activity might be inferred from high volume during the early part of the decline.

Support & Resistance

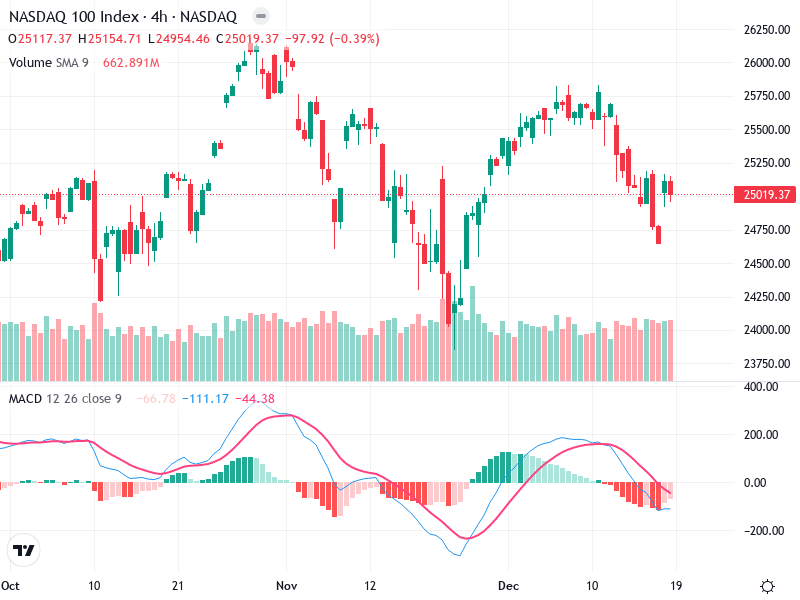
Support around 24,750 has acted as a recent area of buying interest.

Resistance near 25,500, which the price failed to maintain, leading to the current downturn.

These levels are crucial for identifying potential reversals or continuation patterns; breaking or bouncing from these levels will dictate near-term action.

Actionable Insights

Consider selling or shorting if the price closes below the 24,750 support level with increased volume.

Monitor for signs of reversal around current levels, especially if supported by a bullish MACD crossover or reduced selling volume.

A confirmed break above 25,500 on strong volume could signal bullish momentum resumption.

The AI Technical Analysis Center is an informational tool only and does not constitute investment or trading advice.
This site is registered on wpml.org as a development site. Switch to a production site key to remove this banner.