Generic selectors
Exact matches only
Search in title
Search in content
Post Type Selectors

Popular stocks

Crypto

CFD

Currencies

Support

Gold

NSDQ – Technical Analysis – 4h

December 23, 2025 08:01

Quick Summary

The NASDAQ 100 Index chart exhibits signs of a potential bullish recovery after a minor bearish phase, with the MACD crossover signaling upward momentum. Recent volume spikes indicate strong buying interest, suggesting institutional activity. Key resistance levels near 26,000 and support around 24,300 provide important trading cues for traders.

Candlestick Analysis

There is a recent bullish pattern with green candles showing upward momentum. Look for any potential bullish engulfing patterns around the recent lows.

No distinct reversal patterns like doji or hammer seen in the last few candles.

The market displayed a minor bearish phase but is now recovering, showing a potential shift to a bullish trend.

MACD Analysis

The MACD line has crossed above the Signal line, indicating a bullish crossover which suggests upward momentum.

The histogram has moved from negative to positive territory, showing increasing momentum in the upward trend.

Look for any divergences as the MACD continues to rise while price action trends upwards, though none are apparent immediately.

Volume Analysis

There is a notable spike in volume during the recent upward movement, suggesting strong buying interest and potential institutional activity.

The increase in volume aligns with the increase in price, reinforcing the bullish sentiment.

The large green volume spike coincides with the recent bullish movement, often a sign of accumulation.

Support & Resistance

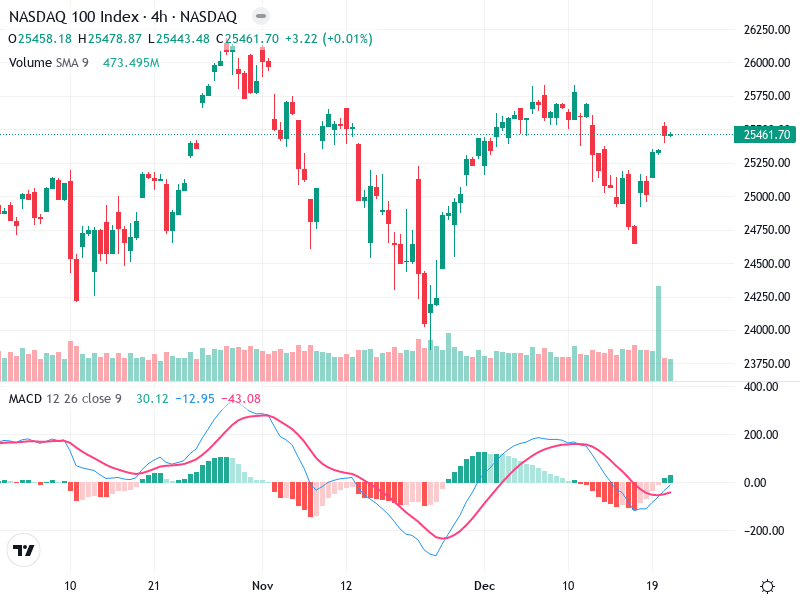
Support around 24,300 observed from the recent low after a significant volume surge.

Resistance approaching 25,700 to 26,000, previous highs that might serve as a barrier to further gains.

These levels will be crucial for traders to watch for any potential breakout or reversal signals.

Actionable Insights

Consider initiating or adding to long positions on pullbacks to support levels, particularly if the price holds above the 25,000 area.

Maintain current positions if the trend remains bullish and breaks above resistance levels.

Stay vigilant for any reversal patterns near resistance or confirmation of continued bullish momentum.

The AI Technical Analysis Center is an informational tool only and does not constitute investment or trading advice.
This site is registered on wpml.org as a development site. Switch to a production site key to remove this banner.