Generic selectors
Exact matches only
Search in title
Search in content
Post Type Selectors

Popular stocks

Crypto

CFD

Currencies

Support

Gold

NSDQ – Technical Analysis – 4h

December 24, 2025 08:00

Quick Summary

The asset is displaying bullish tendencies, driven by strong upward momentum seen on the chart. A breakout near key levels suggests expanding buying interest, while resistance levels are being tested, potentially setting the stage for further gains.

Technical indicators back this bullish sentiment, signaling possible continued uptrend unless key resistances are breached.

Candlestick Analysis

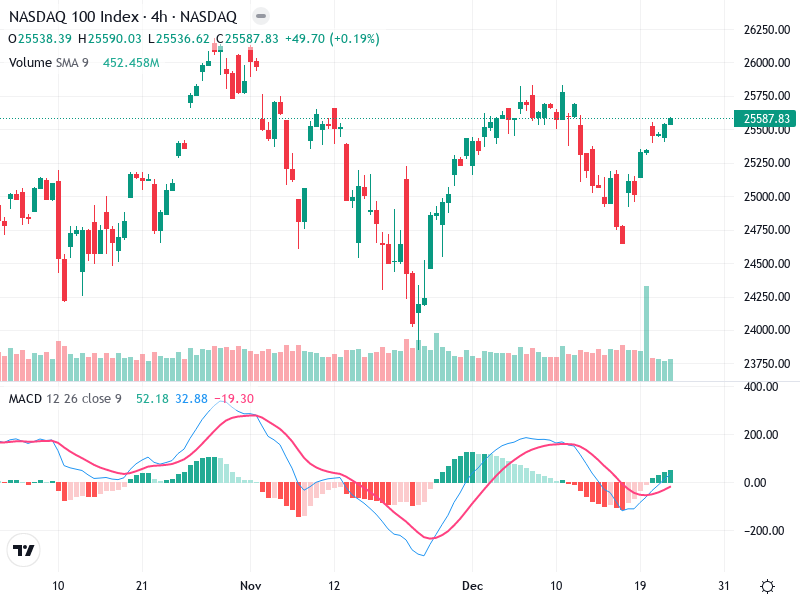
The current trend appears to be bullish, with a series of higher highs and higher lows developing after a previous period of bearish movement.

There's evidence of a bullish engulfing pattern around mid-November, which has led to the recent uptrend.

A potential breakout occurred near the 25,500 level, pushing the price higher from consolidation.

MACD Analysis

The MACD line is above the Signal line, indicating a bullish crossover. This suggests upward momentum.

The histogram is positive and increasing, supporting the idea of growing bullish momentum.

There are no clear divergences noted between MACD and price action at the moment.

Volume Analysis

There was a noticeable spike in volume accompanying the upward price movement in early December, suggesting strong buying interest.

The rise in volume supports the bullish price action, indicating this move could be sustainable.

The volume spike suggests potential institutional involvement, adding confidence to the breakout.

Support & Resistance

Key support is evident around 24,500-25,000, where past consolidations were observed.

A significant resistance level is around the 26,000 mark, which needs to be watched for potential upward continuation or rejection.

Actionable Insights

Consider buying on pullbacks around the 25,500 support level, using a stop loss below recent lows.

Monitor the 26,000 resistance. A failure to break this level with sustained volume could be an opportunity to take profits.

Holding is advisable as long as the bullish indicators remain intact.

The AI Technical Analysis Center is an informational tool only and does not constitute investment or trading advice.
This site is registered on wpml.org as a development site. Switch to a production site key to remove this banner.