Generic selectors
Exact matches only
Search in title
Search in content
Post Type Selectors

Popular stocks

Crypto

CFD

Currencies

Support

Gold

NSDQ – Technical Analysis – 4h

December 25, 2025 08:00

Quick Summary

The NASDAQ 100 Index shows significant movement as it recovers from a recent pullback. The chart indicates potential for a bullish trend if current levels are sustained.

Traders are closely watching resistance and volume trends for further insights.

Candlestick Analysis

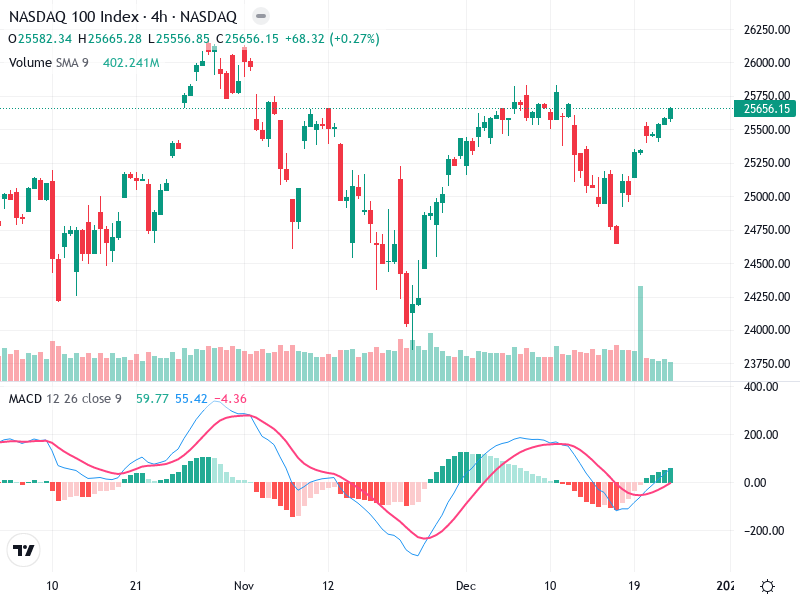
The index is exhibiting a recovery from the recent pullback, showing a bullish trend in the short term.

A series of bullish candles can be observed as the price moves upwards, indicating strong buying interest.

The region around 25,750 seems to be a current resistance level, as the price approaches it with previous failed attempts to break through.

MACD Analysis

There is a bullish crossover as the MACD line (blue) has crossed above the signal line (red), suggesting positive momentum.

The histogram has shifted from negative to positive, showing increasing momentum.

There is no apparent divergence between MACD and price, supporting the current upward trend.

Volume Analysis

A significant spike in volume was noted recently, coinciding with an upward move, which could indicate institutional buying.

Current volume levels are in line with moving averages, supporting the price action.

The surge in volume suggests powerful buyers supporting the recent upward movement, lending credibility to the bullish sentiment.

Support & Resistance

25,750 is a major resistance zone currently being tested. A successful breakout will be a bullish sign.

25,000 appears to act as a robust support level in the case of a price downturn.

The 50 EMA/MA could serve as potential further reinforcement or resistance, pending its analysis if plotted.

Actionable Insights

Watch for a clear breakout above 25,750 with strong volume for a potential buy entry.

Investors may consider taking partial profits if the price shows signs of resistance around 25,750.

Observe for any reversal patterns near resistance or MACD changes that might indicate weakening momentum.

The AI Technical Analysis Center is an informational tool only and does not constitute investment or trading advice.
This site is registered on wpml.org as a development site. Switch to a production site key to remove this banner.