September 5, 2025 07:00
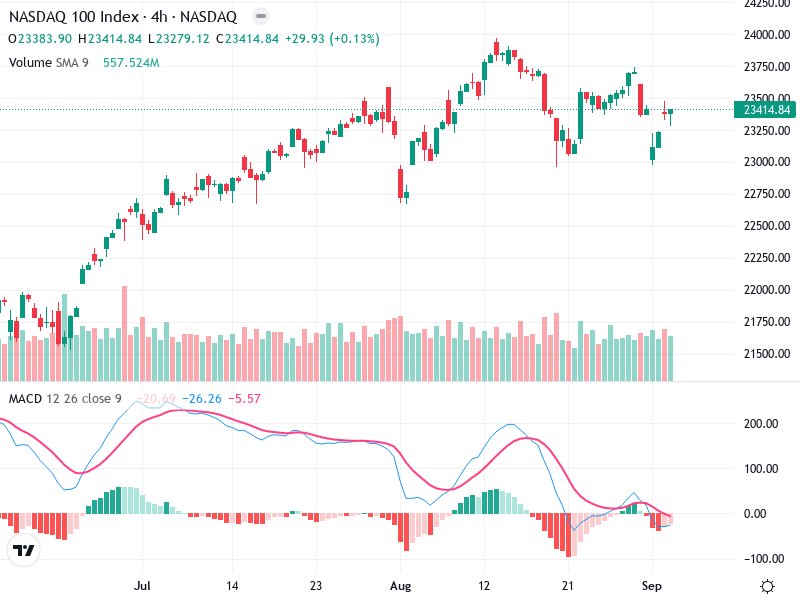
The NASDAQ 100 Index 4-hour chart currently exhibits a bullish trend with consistent upwards movement.
Despite minor pullbacks, the overall market structure remains positive with potential for further growth.
The overall trend is bullish, indicated by higher highs and higher lows.
No reversal patterns like doji or hammer are visible, though small red candles indicate minor pullbacks.
Price consolidation around the 23,400 level follows a pullback from a high near 23,750.
The MACD line is very close to the Signal line, suggesting indecision.
The histogram is ticking downwards, hinting at reduced bullish momentum.
No clear divergences are currently noted, but weakening momentum is possible.
Trading volume remains stable with no significant spikes.
A decrease in volume during pullbacks suggests weaker bearish pressure.
No unusual spikes indicate institutional activity at this time.
Resistance is noted around 23,750, recently acting as a ceiling for price action.
Support is visible near the 23,250 level, maintaining through the latest pullback.
Breaching these levels will be crucial for future price direction, with potential for a continued bullish trend above resistance.
Considering the bullish trend, a hold strategy might be wise amid MACD weakness.
Monitor for a MACD bearish crossover and price action near 23,750 and 23,250 for breakout signals.
Risks include a confirmed bearish crossover with increased volume potentially signaling reversal.