Generic selectors
Exact matches only
Search in title
Search in content
Post Type Selectors

Popular stocks

Crypto

CFD

Currencies

Support

Gold

NSDQ – Technical Analysis – 4h

December 29, 2025 08:00

Quick Summary

This analysis provides an overview of the current technical setup for the asset. The chart reveals important insights about trends and potential future movements. Traders should consider these observations when planning their next steps.

Candlestick Analysis

The chart shows a recent bullish trend after a strong recovery from a previous downtrend. The trend is currently moving upwards.

There is a noticeable bullish engulfing pattern just prior to the recent uptrend, which indicated a reversal.

The recent high near 25,700 represents a potential breakout zone. If crossed, it may lead to further upward momentum.

MACD Analysis

The MACD line is above the Signal line, indicating a bullish crossover which suggests a positive momentum.

The MACD histogram is in positive territory and expanding, indicating strengthening bullish momentum.

There is no obvious divergence between the MACD and the price action, supporting the current trend continuation.

Volume Analysis

A significant volume increase is observed alongside the recent price rise, indicating strong buying interest.

A particular sharp spike in volume suggests potential institutional activity. This supports the validity of the recent price movements.

The overall volume trend aligns with the bullish price action, reinforcing the current trend direction.

Support & Resistance

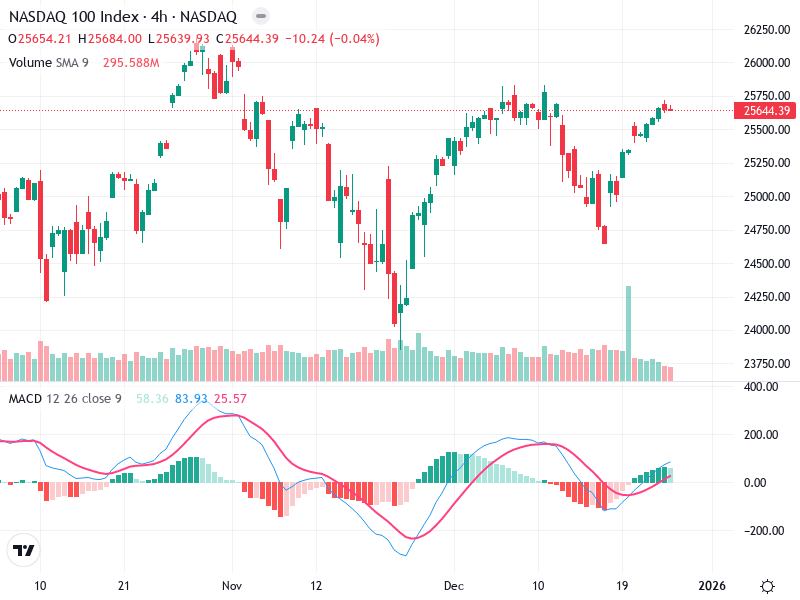
The key support level is around 25,000, where previous consolidation and a reversal were noted.

The current price is approaching resistance near 25,700, a significant level that has been tested before.

These levels are crucial for future price movements and should be monitored closely.

Actionable Insights

Consider buying if the price breaks above the 25,700 level with sustained volume.

Watch for potential bearish patterns or volume exhaustion near resistance levels for selling opportunities.

Current holders may continue to hold if the price remains above the support level and MACD remains bullish.

The AI Technical Analysis Center is an informational tool only and does not constitute investment or trading advice.
This site is registered on wpml.org as a development site. Switch to a production site key to remove this banner.