Generic selectors
Exact matches only
Search in title
Search in content
Post Type Selectors

Popular stocks

Crypto

CFD

Currencies

Support

Gold

NSDQ – Technical Analysis – 4h

December 30, 2025 08:00

Quick Summary

The chart displays a recovery from a previous downtrend, indicating a shift in momentum. Recent patterns and levels suggest potential bullish movement.

With key support and resistance levels identified, these will be crucial in determining future price action.

Candlestick Analysis

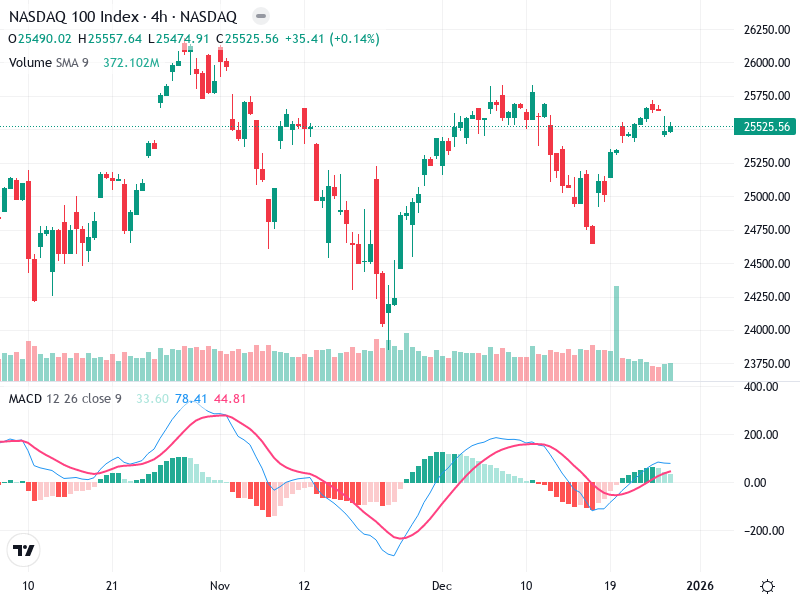
The chart currently shows a bullish trend following a significant recovery from the prior downtrend.

There is a noticeable bullish engulfing pattern near the recent lows, which has been followed by upward movement, indicating strong buying interest.

The recent breakout zone is around the 24,500 mark, with a pullback currently consolidating above it, suggesting a potential support level.

MACD Analysis

The MACD line is above the signal line, confirming a bullish crossover. This indicates positive momentum.

The MACD histogram shows increasing positive heights, reflecting strengthening momentum.

No significant divergence observed between MACD and price, aligning with the current upward price action.

Volume Analysis

There was a spike in volume during the recent low, indicating strong buying interest which supported the price reversal.

Current volume is decreasing slightly, typical in a consolidation phase after a move.

Past volume spikes suggest institutional activity, supportive of the recent bullish trend's initiation.

Support & Resistance

Key support is around 24,500, where the recent breakout occurred.

Major resistance exists near 25,750, which aligns with the prior price highs.

These levels will be crucial for determining potential reversals or continued trends.

Actionable Insights

Consider maintaining a 'buy' position with a focus on the support around 24,500.

Watch for a breakout above 25,750 as confirmation of continued bullish momentum.

A drop below 24,500 could signal a potential reversal, warranting caution.

The AI Technical Analysis Center is an informational tool only and does not constitute investment or trading advice.
This site is registered on wpml.org as a development site. Switch to a production site key to remove this banner.