Generic selectors
Exact matches only
Search in title
Search in content
Post Type Selectors

Popular stocks

Crypto

CFD

Currencies

Support

Gold

NSDQ – Technical Analysis – 4h

January 8, 2026 08:01

Quick Summary

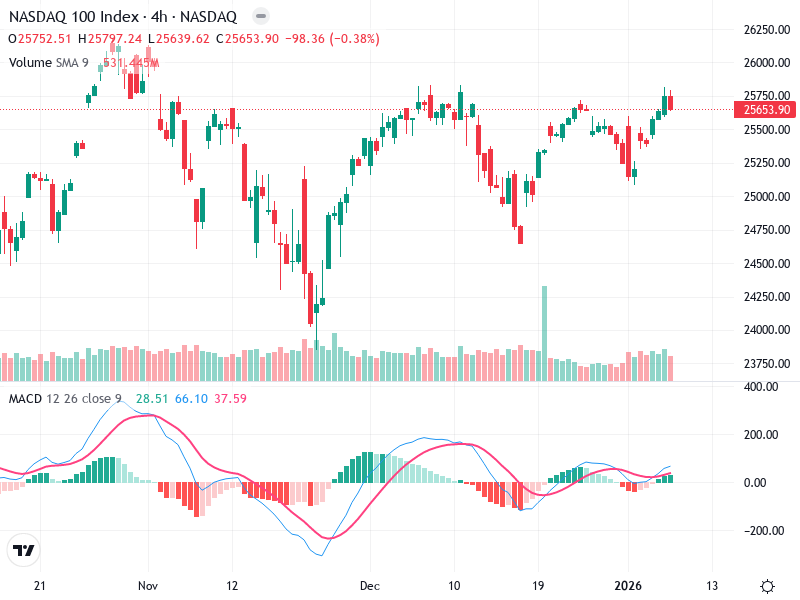
The NASDAQ 100 index has been witnessing significant movements on the charts, indicating potential trading opportunities. The asset shows a bullish tendency in recent times with a notable breakout from past resistance levels.

Current indicators suggest that the trend might continue if key support levels are maintained.

Candlestick Analysis

A bullish candlestick recently broke above previous resistance, indicating strong buying pressure.

An earlier bullish engulfing pattern signaled a potential reversal from a prior downtrend.

The chart shows a bullish trend with higher highs and higher lows following a previous downtrend.

MACD Analysis

The MACD line is currently above the signal line, signaling a bullish crossover.

The histogram is positive and increasing, supporting momentum in the uptrend.

No significant divergence between MACD and price action affirms price movement.

Volume Analysis

There was a notable volume spike during the breakout, reinforcing the bullish move.

Volume supports the uptrend; increased trading during upward moves enhances credibility.

Previous spikes around support levels may indicate institutional interest.

Support & Resistance

Support is at 25,550, followed by 25,000.

Resistance is near the psychological level of 26,000.

These levels are crucial for observing reversals or confirmed breakouts.

Actionable Insights

Consider buying on pullbacks towards 25,550 with a stop below this level.

Monitor for a potential break above 26,000 for more buying opportunities.

Be cautious of any bearish reversal patterns near resistance levels.

The AI Technical Analysis Center is an informational tool only and does not constitute investment or trading advice.
This site is registered on wpml.org as a development site.