Generic selectors
Exact matches only
Search in title
Search in content
Post Type Selectors

Popular stocks

Crypto

CFD

Currencies

Support

Gold

NZD/USD – Technical Analysis – 4h

September 16, 2025 07:06

Quick Summary

The NZD/USD 4-hour chart shows an intriguing pattern with recent bullish momentum.

The asset is facing resistance at key levels, prompting close monitoring of price movements.

Current technical indicators suggest a cautious approach, keeping an eye on the bullish trend.

Candlestick Analysis

The overall trend seems to be bullish, marked by higher highs and higher lows.

There's noticeable bullish momentum after a series of green candlesticks, with no major patterns observed in the latest candles.

Small pullbacks within the trend indicate potential continuation signals.

MACD Analysis

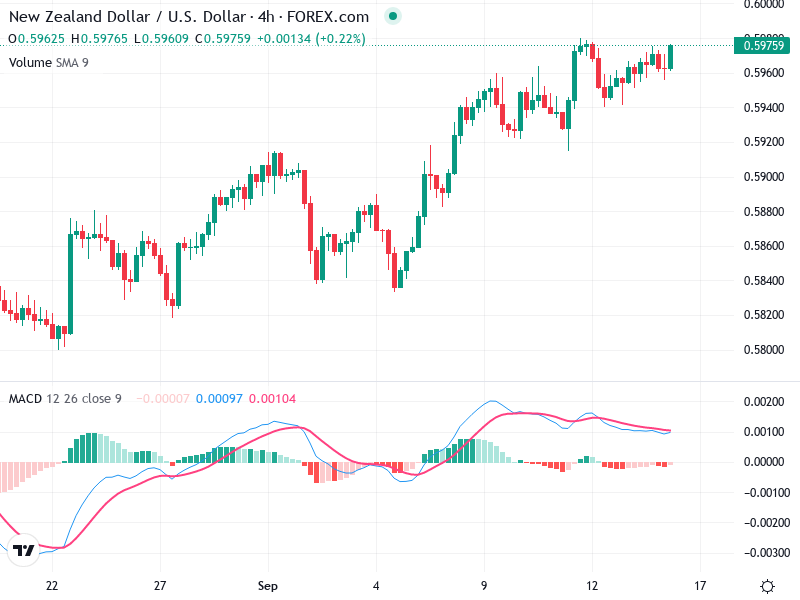
The MACD line is slightly above the Signal line, indicating a recent bullish crossover.

The MACD histogram shows diminishing strength with decreasing green bars, suggesting a potential slowdown or consolidation phase.

No significant divergence observed between price action and MACD, indicating the current trend may still hold.

Volume Analysis

Volume is relatively stable with no significant spikes indicating unusual activity.

The consistent volume aligns with the price trend, supporting the current bullish move without suggesting major institutional activity.

Stability can signal confidence among participants but warrants attention for dynamic changes.

Support & Resistance

Support is around 0.5920, where previous pullbacks found relief.

Resistance is around 0.5980, where price action is currently facing a challenge.

A breakout above 0.5980 might reinforce the bullish trend, whereas a rejection could lead to a retest of lower support.

Actionable Insights

Consider a buy if there is a confirmed breakout above 0.5980 with increased volume or a strong bullish candlestick pattern.

Be cautious of selling unless a bearish reversal pattern appears near resistance or a MACD bearish crossover.

Holding is advisable if the price remains in the current consolidation phase without breaking support or resistance decisively.

The AI Technical Analysis Center is an informational tool only and does not constitute investment or trading advice.
This site is registered on wpml.org as a development site. Switch to a production site key to remove this banner.