Generic selectors
Exact matches only
Search in title
Search in content
Post Type Selectors

Popular stocks

Crypto

CFD

Currencies

Support

Gold

NZD/USD – Technical Analysis – 4h

January 27, 2026 13:00

Quick Summary

The USD chart exhibits a strong bullish trend, characterized by a series of higher highs and higher lows.

The presence of consistent green candles indicates buyer dominance, although resistance at 0.5995 remains a challenge.

Volume levels are steady, suggesting a stable trend rather than speculative moves.

Candlestick Analysis

The chart shows a strong bullish trend with a series of higher highs and higher lows.

Recently, there appears to be multiple consecutive bullish candlesticks indicating strong upward momentum.

No specific complex patterns like engulfing or doji were identified, but consistent green candles show buyer dominance.

MACD Analysis

The MACD line is above the Signal line, confirming a bullish crossover that supports the ongoing upward trend.

The MACD histogram is moderately above zero, indicating sustained bullish momentum.

No significant divergence is observed between price and the MACD, supporting the legitimacy of the uptrend.

Volume Analysis

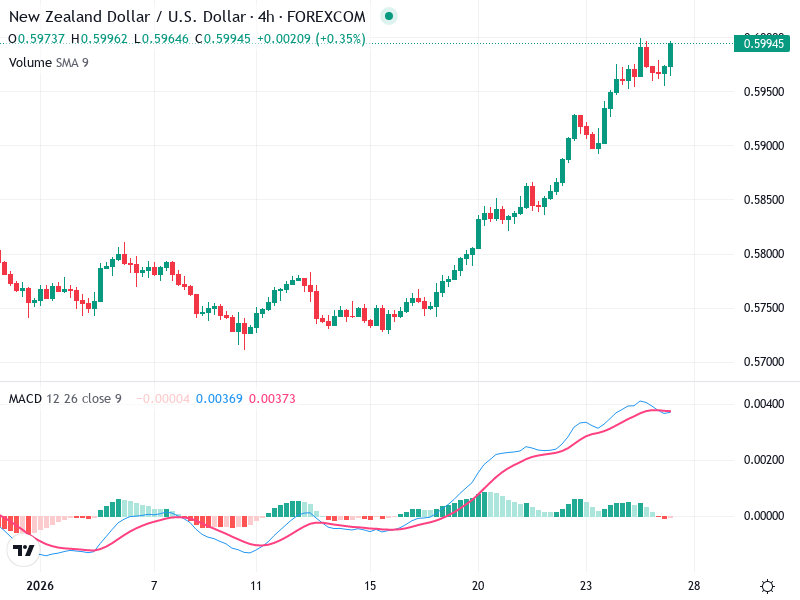
Volume levels appear consistent without major spikes, indicating a steady trend rather than speculative or volatile moves.

The current volume moderately supports the price increase, although a spike would provide stronger confirmation of the breakout potential.

Volume analysis suggests stability in the trend, but additional volume would confirm a strong breakout.

Support & Resistance

The current price is testing the resistance level at 0.5995.

A breakout above this level with increased volume could signal further upside.

Key support is observed around 0.5900, where previous consolidation occurred, providing a potential floor if the resistance holds.

Actionable Insights

A breakout above 0.5995, confirmed by higher volume, could be a signal for a long position.

Consider holding if already in a position and waiting for signs of resistance break or consolidation.

A rejection at resistance without volume could prompt a short-term sell strategy or a tighter stop-loss.

The AI Technical Analysis Center is an informational tool only and does not constitute investment or trading advice.
This site is registered on wpml.org as a development site. Switch to a production site key to remove this banner.