Generic selectors
Exact matches only
Search in title
Search in content
Post Type Selectors

Popular stocks

Crypto

CFD

Currencies

Support

Gold

NZD/USD – Technical Analysis – 4h

January 28, 2026 13:01

Quick Summary

The NZD/USD 4-hour chart shows an evident upward trend. The asset has been experiencing a series of bullish moves, supported by technical indicators.

Current price action suggests potential for further gains, providing opportunities for traders.

Candlestick Analysis

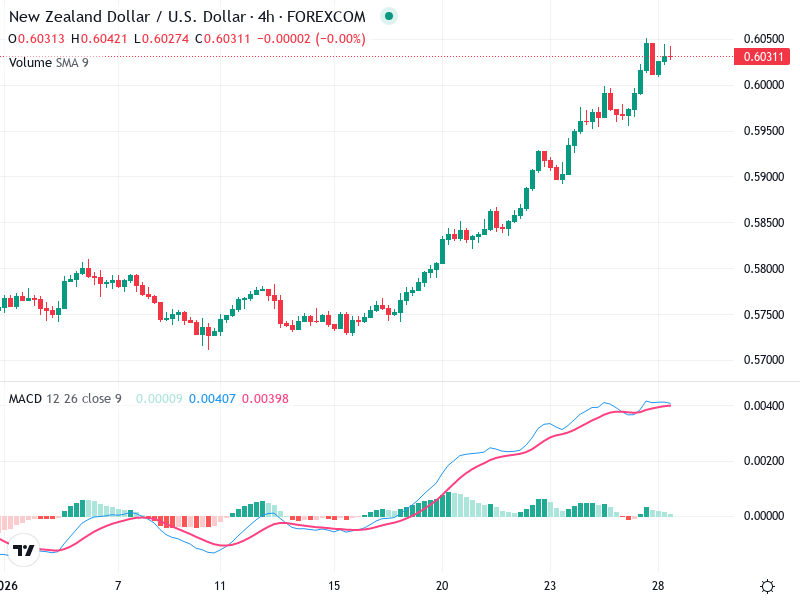
The chart shows a series of bullish candlesticks, indicating strong buying interest.

Near the current price region, there appears to be consolidation with smaller-bodied candles, which could suggest a pause before the next move.

The trend is clearly bullish, with higher highs and higher lows evident on the chart.

MACD Analysis

The MACD line is above the Signal line, demonstrating a bullish crossover condition.

The histogram is showing slight waning momentum, which could indicate a potential slowing down of the upward movement or a possible consolidation phase.

Currently, there are no clear divergences between MACD and price action.

Volume Analysis

Volume appears stable with no significant spikes, suggesting steady trading interest without marked institutional activity.

The recent price increase is supported by consistent volume, indicating genuine buying interest.

Volume remains moderate, indicating sustained interest in the current trend.

Support & Resistance

Recent price action indicates a minor resistance zone around 0.6050. A breakout above this level could signal further upward movement.

Immediate support can be seen around 0.6000, a psychological level where buyers have previously entered.

These levels are crucial for determining potential entry and exit points in the market.

Actionable Insights

Consider entering if there is a confirmed breakout above 0.6050 with increased volume.

Maintain positions while above 0.6000, watching for bullish continuation signals.

If price fails to hold 0.6000 convincingly, consider reducing positions or watching for a reversal signal.

The AI Technical Analysis Center is an informational tool only and does not constitute investment or trading advice.
This site is registered on wpml.org as a development site. Switch to a production site key to remove this banner.