Generic selectors
Exact matches only
Search in title
Search in content
Post Type Selectors

Popular stocks

Crypto

CFD

Currencies

Support

Gold

NZD/USD – Technical Analysis – 4h

February 16, 2026 13:00

Quick Summary

The chart for illustrates a period of consolidation with little directional momentum. The presence of indecisive candlestick patterns suggests a potential shift in trend could occur. Despite the lack of clear direction, price movements remain within a defined range, indicating a phase of equilibrium.

Candlestick Analysis

The chart exhibits a sideways trend in the short term, with some recent consolidation around the 0.604 level.

A few small-bodied candles suggest indecision, possibly hinting at a potential reversal or continuation pattern forming.

No distinct patterns like a bullish engulfing or doji are prominent at the current level.

MACD Analysis

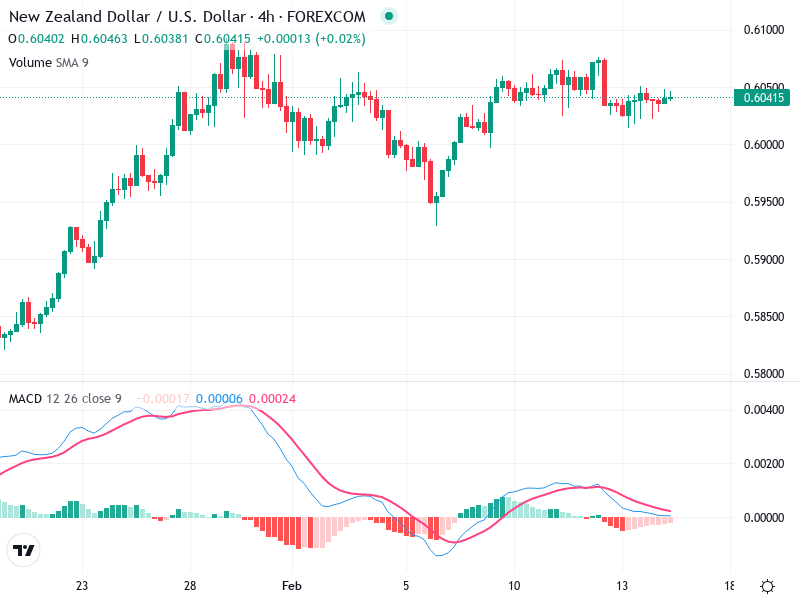
The MACD line is close to the Signal line, suggesting a lack of strong momentum in either direction. There isn’t a clear bullish or bearish crossover right now.

The histogram bars are small, indicating minimal momentum, aligning with the sideways price movement.

No clear divergence is observed between the MACD and the price action, reinforcing the current consolidation phase.

Volume Analysis

Volume appears steady, with no significant spikes, suggesting a lack of strong buying or selling pressure at the moment.

The consistent volume supports the sideways trend and reflects a period of equilibrium between buyers and sellers.

Maintaining steady volume further emphasizes the current period of consolidation in the market.

Support & Resistance

Immediate support is around the 0.600 mark, which has been tested multiple times, indicating its strength.

Resistance is at approximately 0.610, where past attempts to move higher have been rejected.

The preservation of these levels is crucial to understanding future price movements.

Actionable Insights

Given the current consolidation, it might be prudent to wait for a breakout above 0.610 for bullish confirmation or below 0.600 for bearish momentum.

Look for a decisive MACD crossover and a volume spike to confirm any breakout.

A lack of volume could lead to false breakouts; therefore, confirmation with volume is crucial.

The AI Technical Analysis Center is an informational tool only and does not constitute investment or trading advice.
This site is registered on wpml.org as a development site. Switch to a production site key to remove this banner.