Generic selectors
Exact matches only
Search in title
Search in content
Post Type Selectors

Popular stocks

Crypto

CFD

Currencies

Support

Gold

NZD/USD – Technical Analysis – 4h

February 17, 2026 13:01

Quick Summary

The chart of reveals a significant period of consolidation with a narrow trading range. The asset has been oscillating around the 0.60308 level, suggesting a range-bound market environment. Traders are advised to monitor for potential breakouts as this could indicate a forthcoming trend direction.

Candlestick Analysis

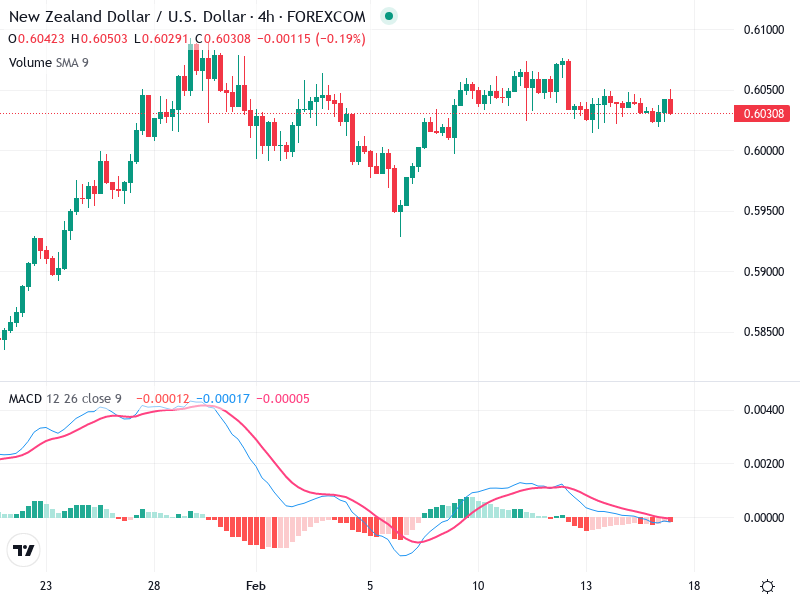
The chart shows multiple instances of doji and small-bodied candles toward the right, indicating potential indecisiveness in the market. Previously, there was a bullish engulfing pattern which led to a temporary uptrend.

The market displays a sideways trend after a strong bullish move followed by a correction. Currently, the price is consolidating near 0.60308.

The price is consolidating without a clear breakout. Watch for a break above 0.60500 for bullish momentum or below 0.60000 for bearish continuation.

MACD Analysis

The MACD line (blue) is slightly above the Signal line (red), but both are nearly converged, indicating weak momentum.

The MACD histogram shows very small bars near the zero line, suggesting decreasing momentum and a possible sideways trend continuation.

No significant divergences are visible currently between MACD and price action.

Volume Analysis

Volume appears to be low and consistent, confirming the current sideways consolidation.

Lower volume during price consolidation often confirms a lack of conviction in either direction.

No unusual spikes in volume suggesting major institutional activity.

Support & Resistance

Support Zones: Around 0.60000, acting as a psychological support level.

Resistance Zones: Near 0.60500, recently acting as a ceiling for price movement.

These levels are crucial for identifying potential breakouts or reversals and should be closely monitored.

Actionable Insights

Consider buying if there is a confirmed breakout above the 0.60500 resistance with higher volume.

Look for selling opportunities if the price breaks below the 0.60000 support with momentum.

Until a clear breakout is observed, holding may be advisable due to the observable sideways trend.

The AI Technical Analysis Center is an informational tool only and does not constitute investment or trading advice.
This site is registered on wpml.org as a development site. Switch to a production site key to remove this banner.