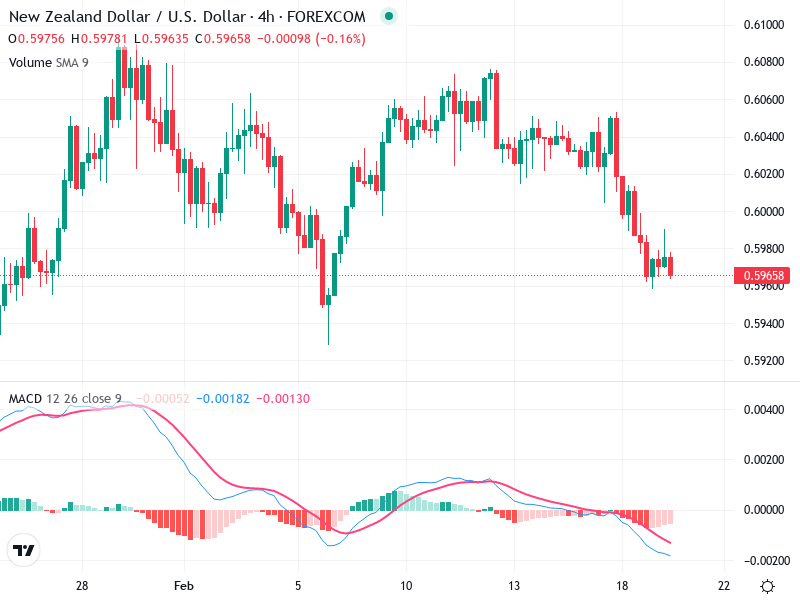
The NZD/USD 4H chart reveals ongoing bearish momentum. The asset’s price is under pressure near key support levels. Recent market activity points to potential downside with a cautious outlook on any reversals.
Candlestick Analysis
The chart exhibits a recent downtrend following a previous sideways movement.
Small-bodied candles near the current price level suggest indecision or a potential reversal.
The trend remains bearish, with lower highs and lower lows.
MACD Analysis
Both the MACD line and Signal line are below the zero line, highlighting bearish momentum.
A recent bearish crossover supports the bearish sentiment.
The histogram displays negative bars increasing in size, reinforcing the bearish outlook.
Volume Analysis
There is a gradual increase in volume accompanying the recent downtrend.
No significant volume spikes suggest a lack of strong institutional counteraction to the trend.
The volume trend supports the ongoing bearish movement.
Support & Resistance
Immediate support is identified around 0.59600.
A break below this support could lead to lower price levels.
Resistance is noted around 0.60600 and potentially stronger at the 0.61000 zone.
Actionable Insights
Consider a sell strategy if the price breaks below 0.59600 with increased volume.
A buy strategy could be explored if bullish reversal patterns emerge.
Holding current positions may be advisable if the price remains within the 0.59600 to 0.60600 range.
The AI Technical Analysis Center is an informational tool only and does not constitute investment or trading advice.