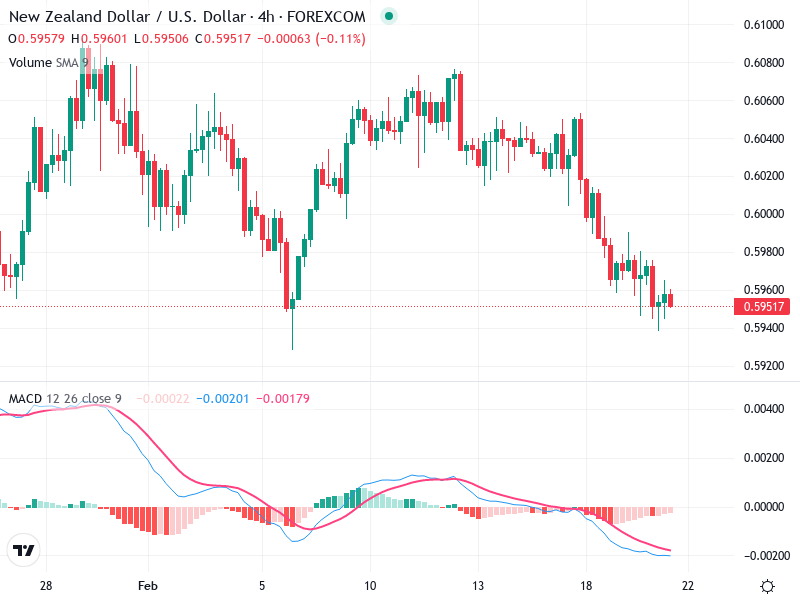
Generic selectors
Exact matches only
Search in title
Search in content
Post Type Selectors

Popular stocks

Crypto

CFD

Currencies

Support

Gold

NZD/USD – Technical Analysis – 4h

February 20, 2026 13:00

Quick Summary

The chart reflects a detailed analysis of with key observations on trend and momentum.

The asset is showing signs of a bearish trend in the short term, though there are potential support and resistance levels in play.

Indicators such as MACD and volume provide further insights into the ongoing market dynamics.

Candlestick Analysis

The chart shows a bearish trend in the short term, with lower highs and lower lows evident.

There are no significant candlestick patterns like bullish engulfing or hammer formations visible at this time.

Recent candles are predominantly bearish, indicating selling pressure.

MACD Analysis

The MACD line is below the Signal line, supporting the bearish sentiment.

The histogram is negative and increasing, showing that bearish momentum might still be building.

There's no clear divergence between MACD and price action at the moment.

Volume Analysis

Volume appears slightly below average based on the simple moving average indicator.

The decreasing volume during the recent price decline suggests a potential weakening of selling strength.

No significant volume spikes are evident, indicating a lack of major institutional action in recent sessions.

Support & Resistance

Key support is near 0.594000.59500, where the price is currently testing.

Resistance is seen in the 0.60600 area, where previous price rebounds have failed.

The price appears to be around a key level, close to 0.59500, which might act as a support zone if the downtrend continues.

Actionable Insights

Traders might consider a cautious short-term buy if the price stabilizes above 0.59500 with confirmation.

A breakdown below 0.59400 could lead to further declines, while a move above 0.60600 could confirm a potential reversal or consolidation phase.

Pay attention to changes in volume that might indicate institutional moves or a reversal in trend.

The AI Technical Analysis Center is an informational tool only and does not constitute investment or trading advice.
This site is registered on wpml.org as a development site. Switch to a production site key to remove this banner.