Generic selectors
Exact matches only
Search in title
Search in content
Post Type Selectors

Popular stocks

Crypto

CFD

Currencies

Support

Gold

NZD/USD – Technical Analysis – 4h

February 26, 2026 13:00

Quick Summary

The chart for the asset shows significant activity at key support and resistance levels.

The asset’s movement reflects both bullish and bearish tendencies, with recent analysis showing a cautious sentiment.

Traders should pay attention to changes in volume and potential breakout or pullback scenarios.

Candlestick Analysis

The chart shows a primarily bearish trend with recent attempts at bullish reversal.

There’s a noticeable formation of a Doji pattern around mid-February, indicating potential indecision in the market.

A potential pullback is visible from the recent highs near 0.60200, suggesting a testing of lower support levels.

MACD Analysis

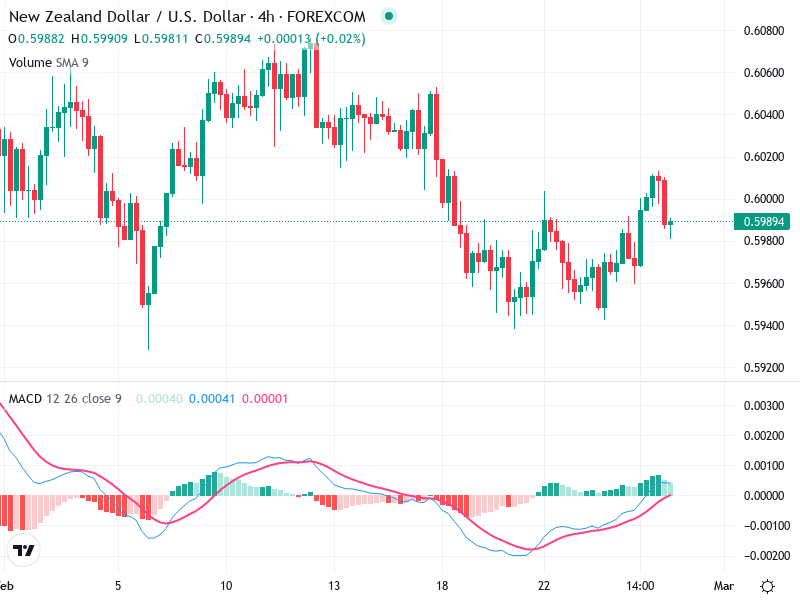
A recent bullish crossover has been observed where the MACD line crosses above the Signal line.

The histogram is in positive territory, showing increased bullish momentum, though with diminishing height, suggesting potential fading momentum.

No apparent divergence between the MACD and the price action currently.

Volume Analysis

There is a moderate increase in volume accompanying the recent upward movements, suggesting some buying interest but not overwhelmingly so.

The increase in volume slightly supports the rise in price, indicating a credible move.

No significant spikes in volume that would strongly indicate institutional activity.

Support & Resistance

A key support level is around 0.59600, where previous price action has repeatedly tested.

Current resistance is evident around 0.60200.

These levels are critical for potential reversals or breakouts. Watching these levels can provide insights into future movements.

Actionable Insights

Consider a hold strategy. Await confirmation of continued bullish momentum if breaking resistance or holding above support for further movement.

A confirmed break above 0.60200 with accompanying volume could signal stronger bullish continuation. Conversely, a drop below 0.59600 could reaffirm a bearish trend.

The sentiment appears cautiously bullish given the recent crossover in MACD and the current testing of resistance levels.

The AI Technical Analysis Center is an informational tool only and does not constitute investment or trading advice.
This site is registered on wpml.org as a development site. Switch to a production site key to remove this banner.