Generic selectors
Exact matches only
Search in title
Search in content
Post Type Selectors

Popular stocks

Crypto

CFD

Currencies

Support

Gold

NZD/USD – Technical Analysis – 4h

February 27, 2026 13:00

Quick Summary

The NZD/USD 4-hour chart shows recent sideways movement after a previous bearish trend. Indecision is evident, lacking strong bullish or bearish momentum. Key resistance and support levels are noted, indicating potential trading opportunities.

Candlestick Analysis

The chart shows a recent sideways movement following a prior bearish trend.

Near the recent price area, there’s a semblance of consolidation with small body candles, indicating indecision.

There isn't a prominent pattern like a bullish engulfing or hammer, which suggests a lack of strong reversal signals currently.

MACD Analysis

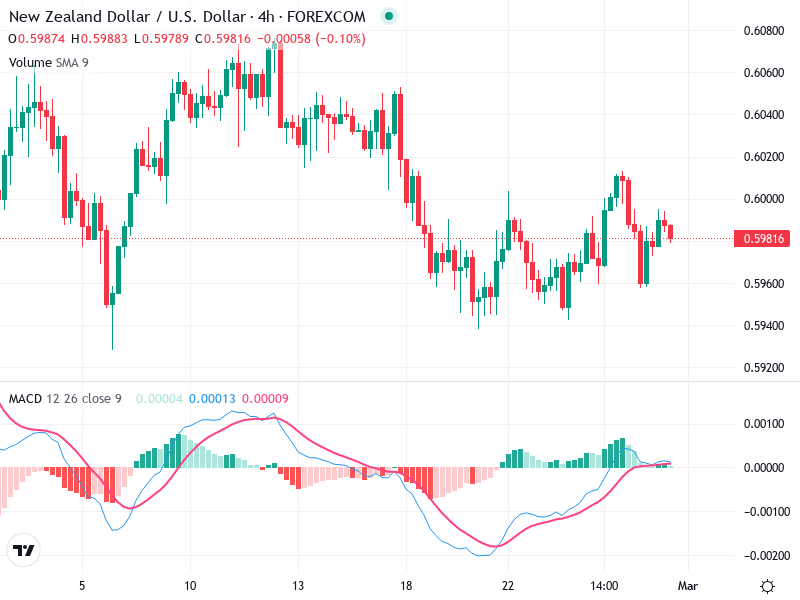
The MACD line is slightly above the Signal line, showing a recent bullish crossover, but the lines are close, suggesting weak momentum.

The histogram shows decreasing green bars, indicating weakening bullish momentum.

There is no clear divergence between the MACD and the price action, meaning the MACD is aligned with recent price movements.

Volume Analysis

There is no significant spike in volume to indicate strong buying or selling pressure.

The recent volume trends support sideways movement.

The stable volume with sideways price action suggests a lack of aggressive trading activity.

Support & Resistance

The area around 0.59600 serves as immediate support where price has previously bounced.

Around 0.60000 is a resistance level; previous attempts to break this level have been unsuccessful in maintaining higher prices.

Monitoring these levels could provide insights into potential breakout or reversal opportunities.

Actionable Insights

Consider buying if there is a breakout above the 0.60000 resistance with accompanying volume increase, indicating strength.

Selling might be prudent if the price breaks below the 0.59600 support with increased bearish volume.

Holding is advisable until a clear breakout with volume either way to confirm a new trend direction.

The AI Technical Analysis Center is an informational tool only and does not constitute investment or trading advice.
This site is registered on wpml.org as a development site. Switch to a production site key to remove this banner.