Generic selectors
Exact matches only
Search in title
Search in content
Post Type Selectors

Popular stocks

Crypto

CFD

Currencies

Support

Gold

NZD/USD – Technical Analysis – 4h

March 4, 2026 13:00

Quick Summary

The analysis of the chart reveals interesting patterns and indicators.

The asset has been showing signs of a potential reversal, highlighted by certain candlestick patterns and volume changes.

Candlestick Analysis

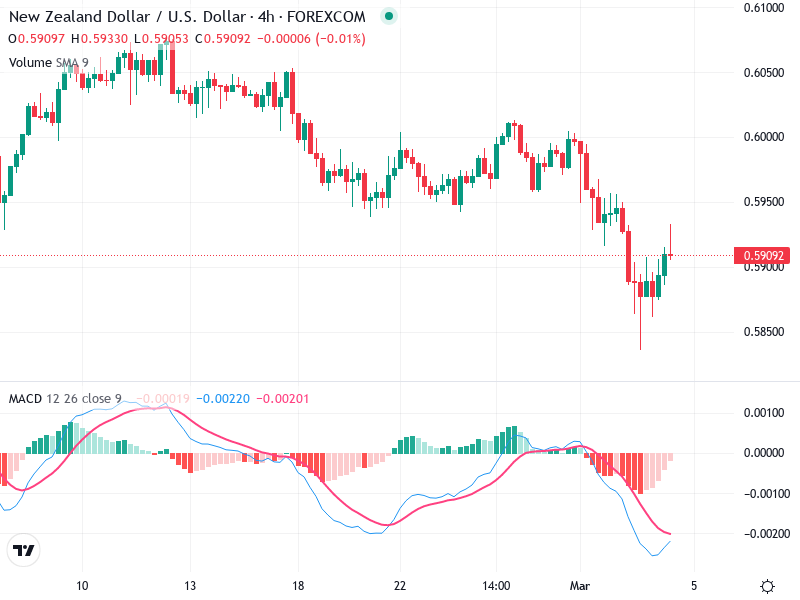
Recently, there appears to be a hammer-like candlestick indicating a potential reversal at the bottom of the trend. This pattern suggests buying interest at lower levels.

The trend is primarily bearish. The price has been making lower highs and lower lows, indicating downward momentum.

The area around 0.5900 is critical. A breakout above this level could suggest a potential reversal or a pullback to previously higher levels.

MACD Analysis

The MACD line is approaching the Signal line, suggesting a potential bullish crossover is imminent. This often indicates a shift in momentum from negative to positive.

The histogram shows decreasing bearish momentum, which supports the potential for the bullish crossover.

No significant divergences are visible between the MACD and the price action.

Volume Analysis

There's been an increase in volume associated with the recent candlestick pattern, adding legitimacy to the hammer formation and potential trend reversal.

The increase in volume supports potential upward movement, as it coincides with a reversal pattern.

An unusual spike in volume close to the bottom hints at possible institutional buying interest.

Support & Resistance

The key support level is around 0.5850, the recent low where the hammer pattern formed.

A resistance zone is near 0.5930. Breaking this level would be a bullish signal.

Actionable Insights

Consider a long position if the price breaks above 0.5930 with sustained volume. Look for confirmation from the MACD crossover.

If the price fails to break above 0.5930 or if a bearish pattern emerges, consider maintaining a bearish outlook.

Confirmation signals such as continued high volume or a strong bullish MACD crossover should be monitored.

The AI Technical Analysis Center is an informational tool only and does not constitute investment or trading advice.
This site is registered on wpml.org as a development site. Switch to a production site key to remove this banner.