Generic selectors
Exact matches only
Search in title
Search in content
Post Type Selectors

Popular stocks

Crypto

CFD

Currencies

Support

Gold

NZD/USD – Technical Analysis – 4h

March 5, 2026 13:00

Quick Summary

The asset is currently exhibiting signs of a potential reversal. Recent price action suggests a struggle with key resistance levels. Analyzing the indicators reveals mixed signals.

Candlestick Analysis

The chart depicts a mostly bearish trend with a recent attempt at a recovery.

There is a potential hammer pattern near the recent low, indicating a possible reversal. This suggests a potential bullish reversal if confirmed with further upward movement.

The price tried to break above the 0.595 level but faced resistance and is currently pulling back slightly.

MACD Analysis

The MACD line has crossed above the Signal line, indicating a bullish crossover. This suggests potential upward momentum.

The histogram is increasing in positive territory, supporting the bullish crossover and indicating strengthening momentum.

No clear divergence is visible between the MACD and the price action at the moment.

Volume Analysis

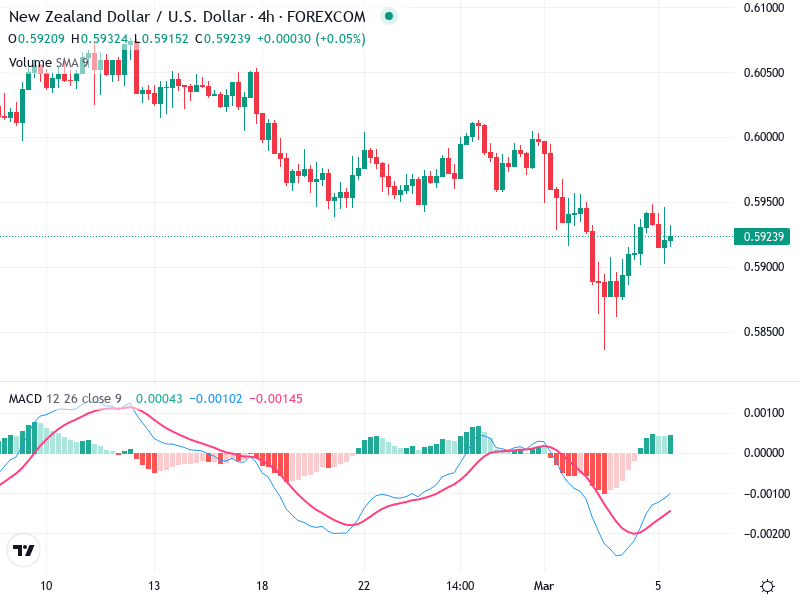
Volume is relatively stable but there's a slight increase during the recent price recovery, suggesting moderate buying interest.

No significant unusual volume spikes, implying a lack of strong institutional activity at this point.

Overall, volume trends suggest cautious optimism among traders.

Support & Resistance

Key support is observed around the 0.585 level, where the price rebounded recently.

Immediate resistance is at the 0.595 level, and a stronger one around 0.600.

Monitoring these levels is crucial for determining potential breakout or breakdown scenarios.

Actionable Insights

Consider a buy position if the price can break above the 0.595 resistance with increased volume.

Monitor for continuous positive MACD histogram to confirm sustained bullish momentum. Keep an eye on the 0.585 support level as a stop-loss zone.

If the price falls below the recent support, a retest of lower levels is possible.

The AI Technical Analysis Center is an informational tool only and does not constitute investment or trading advice.
This site is registered on wpml.org as a development site. Switch to a production site key to remove this banner.